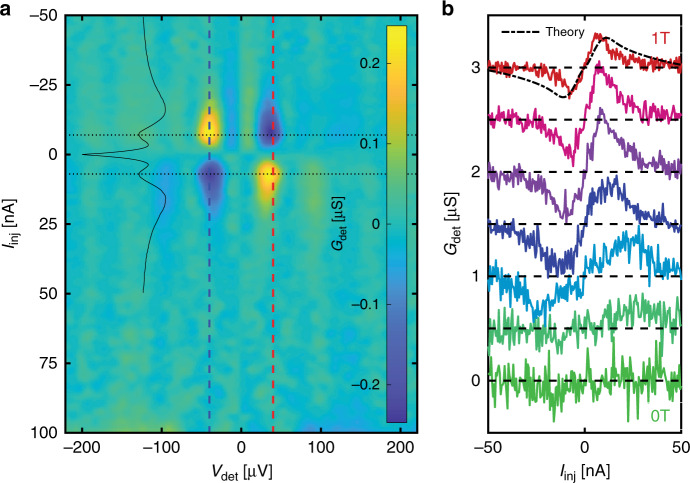
Fig. 5. Close-up of the spin energy mode.
a The odd-in-energy (i.e. ) component of Fig. 4c, corresponding to a charge imbalance, which is well localised in both and Iinj. As a function of , as expected, the charge imbalance only appears at the gap edge: the vertical dashed lines indicate . As a function of the injection current, the signal is maximal (horizontal dotted lines) when only spins of one species (spin down excitations) are injected: Ginj(Vinj) is shown as a thin black line; its scale in the horizontal direction is in arbitrary units. b A vertical slice of a at and the same measurement at different magnetic fields linearly spaced down to H = 0 T. The theoretical prediction for H = 1 T is shown in black. The charge imbalance increases slightly then decreases as the magnetic field is lowered. At H = 0 it is undetectable.

