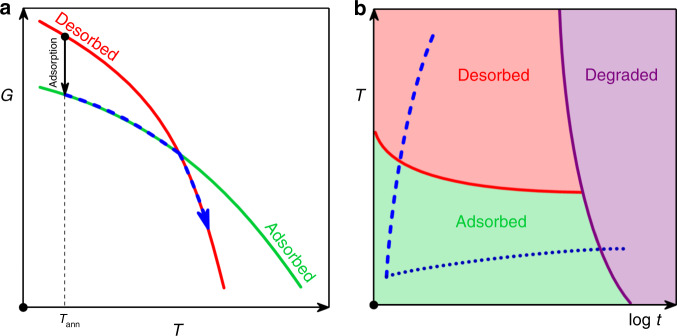
Fig. 1. Phase diagram and kinetic stability of an adsorbed layer.
a Schematic representation of the dependence of Gibbs-free energy (G) on temperature (T) for the desorbed (red line) and the adsorbed (green line) phases. In our experiments, adsorption is achieved isothermally at low temperatures; the adsorbed layers are then heated at a constant rate up to high temperatures where desorption takes place spontaneously. The blue dashed line indicates the thermodynamic path followed by heating the sample at a high rate. b Schematic representation of TTT (time–temperature–transformation) diagram for an adsorbed polymer layer. The blue dashed line and the dark blue dotted line indicate CHT (constant heat transformation) processing protocols at, respectively, fast and slow rate. Degradation is circumvented by heating the adsorbed layer at a fast scanning rate.

