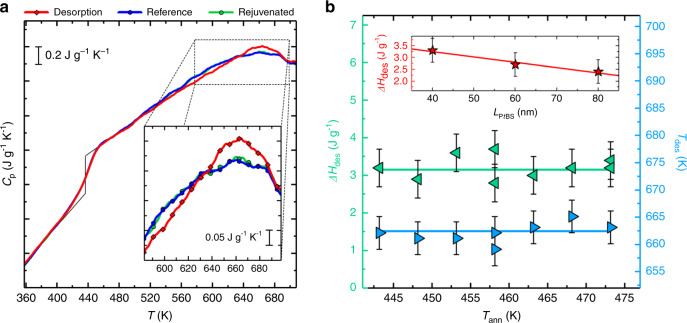
Fig. 2. Desorption transition in PtBS thin films.
a Heating scans at 104 K s−1 after annealing at 458 K for 5 × 10⁴ s (red curves), before adsorption (reference, blue curves) and after desorption (rejuvenated, green curves). Black lines at about 440 K highlight the step in the specific heat associated with the glass transition. The inset of a is an enlargement in the temperature range where desorption takes place. b Enthalpy of desorption (left triangles) and temperature of the maximum of the endothermic overshoot (right triangles) as a function of the annealing temperature. The inset of panel b shows the enthalpy of desorption after annealing for 5 × 10⁴ s at 458 K as a function of the film thickness. Error bars account for the uncertainty in the determination of the temperature maximum (Tdes) and intensity (ΔHdes) of the overshoot.

