
Fig. 4. Evolution of the enthalpy of desorption with annealing time.
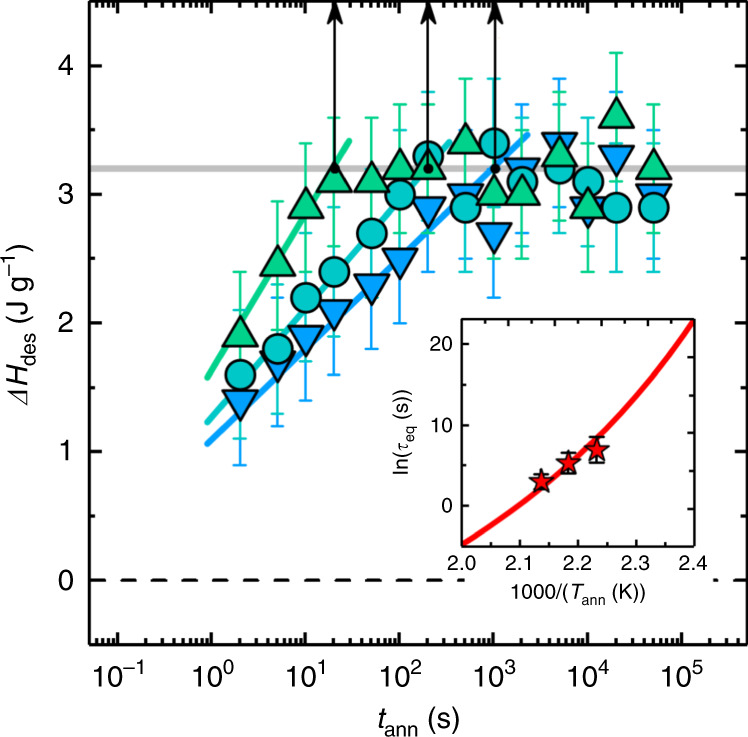
The heat of desorption increases with annealing time, faster kinetics are observed at higher temperatures (448 K blue down-pointed triangles, 458 K cyan circles, 468 K green up-pointed triangles). Vertical arrows indicate the values of τeq, the timescale to reach a plateau in the enthalpy of desorption, at each temperature. Error bars account for the uncertainty in the determination of the intensity of the overshoot. In the inset, red stars indicate the values of τeq, whereas the red line is obtained from the temperature dependence of the segmental mobility, taken from ref. 24. Error bars account for the uncertainty in the determination of the time necessary to reach a constant ΔHdes value in the data set shown in the main panel of the same figure.