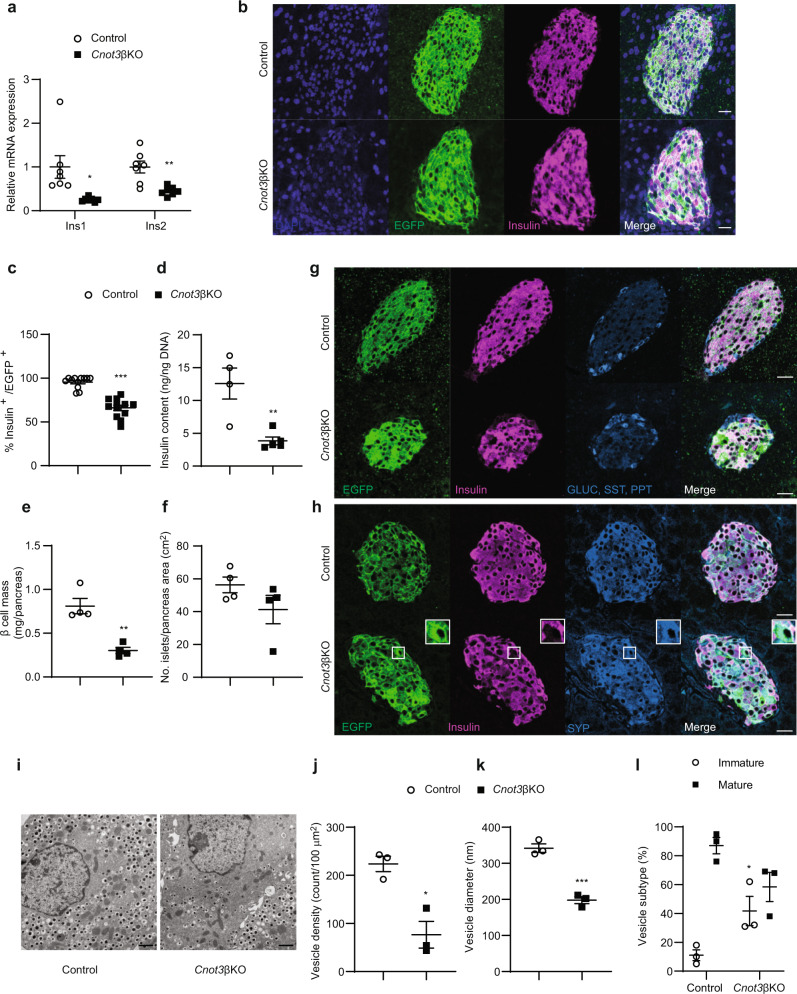
Fig. 3. The lack of CNOT3 in β cells reduces insulin expression.
a qPCR analysis of insulin mRNA isoforms (Ins1 and Ins2), normalized to the Gapdh mRNA level, in control and Cnot3βKO islets (n = 7). b Co-immunofluorescence staining of EGFP (green), insulin (magenta) and DAPI (blue) in pancreatic sections from 8-week-old control and Cnot3βKO mice. A scale bar represents 25 µm. Representative results from three 8-week-old mice from each genotype are shown. c Quantification data of immunofluorescence analysis presented in Fig. 3b. Each data point represents %EGFP+ in Insulin+ β cells in control and Cnot3βKO islets (n = 12) from three 8-week-old mice from each genotype. d Insulin content of islets from 8-week-old control (n = 4) and Cnot3βKO (n = 5) mice. e β-cell mass measurement in pancreatic sections from 8-week-old control and Cnot3βKO mice (n = 4). f Islet number per pancreas area in pancreatic sections from 8-week-old control and Cnot3βKO mice (n = 4). g Co-immunofluorescence staining of EGFP (green), insulin (magenta), GLUC (blue), SST (blue) and PPT (blue) in pancreatic sections from 8-week-old mTmG reporter: “control (Cnot3+,+; +/Ins1-Cre) and Cnot3βKO” mice. A scale bar represents 25 µm. h Co-immunofluorescence staining of EGFP (green), insulin (magenta) and SYP (blue) in pancreatic sections from 8-week-old mTmG reporter: “control (Cnot3+,+; +/Ins1-Cre) and Cnot3βKO” mice. A scale bar represents 25 µm. Representative results from three 8-week-old mice from each genotype are shown. i–l Transmission electron microscopy performed on islets isolated from 8-week-old control and Cnot3βKO mice (n = 3), including quantification of j vesicle density, k vesicle diameter and l the percentage of mature (black bar) and immature vesicles (white bar). A scale bar represents 1 µm. Data are presented as mean ± SEM; *P < 0.05; **P < 0.01; ***P < 0.001, two-tailed Student’s t test.

