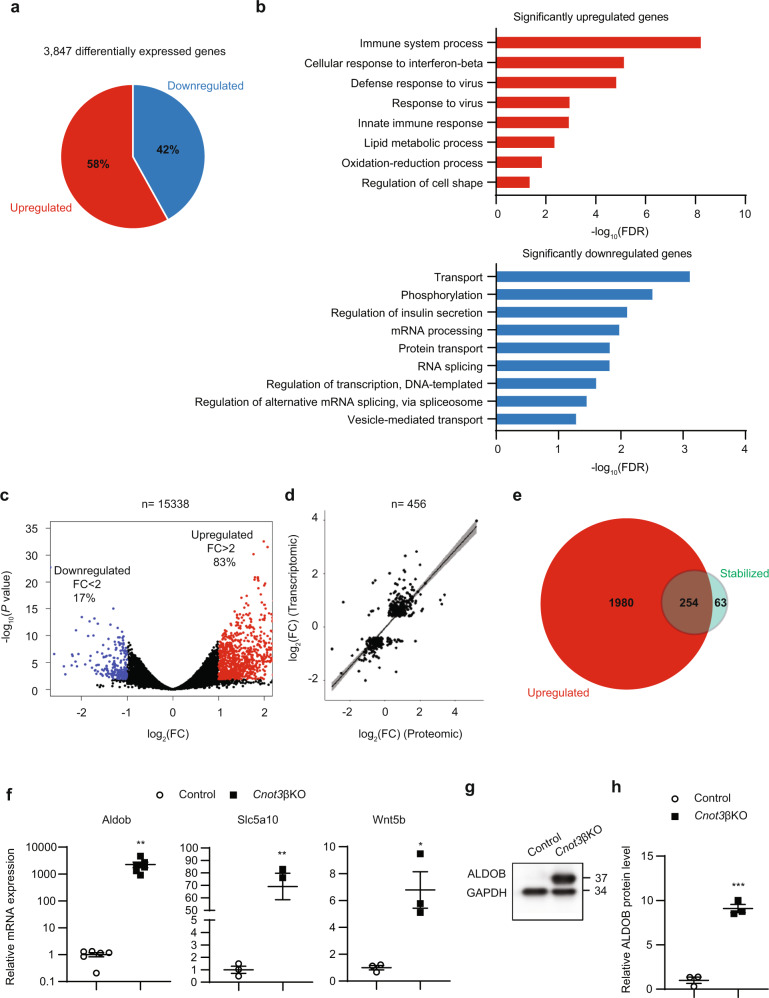
Fig. 5. Global gene expression changes in Cnot3βKO islets.
a 3847 genes were differentially expressed (DE) in islets following CNOT3 depletion in β cells. The graph indicates the percentage distribution of genes differentially expressed (P < 0.05) in Cnot3βKO compared with control islets (n = 3, each sample was pooled from two mice). Multidimensional scaling (MDS) plot is presented in Supplementary Fig. 10. b GO analysis of mRNAs significantly upregulated (red) and downregulated (blue) in Cnot3βKO islets. Bar charts of GO terms (Biological Process) ranked by FDR (<0.05) are shown. Gene lists included in each GO term are summarized in Supplementary Data 1. c Volcano plot of DE genes indicating the percentage distribution of DE (P < 0.05) genes by more than twofold upregulation (red) or downregulation (blue). d Pearson correlation analysis between differentially expressed genes and proteins identified by RNA-seq analysis and MS analysis of control and Cnot3βKO islets. e Venn diagram showing the overlap of significantly upregulated (red) and stabilized (green) mRNAs in Cnot3βKO compared with control islets. f qPCR analysis of three top upregulated and stabilized mRNAs (Aldob, Slc5a10 and Wnt5b), normalized to the Gapdh mRNA level, in control and Cnot3βKO islets (n = 3–6). g Immunoblot analysis of ALDOB in islet lysates from 8-week-old control and Cnot3βKO mice (n = 3). This blot is a representative of three different blots. h Band quantification of immunoblot of ALDOB (n = 3). Data are presented as mean ± SEM; *P < 0.05; **P < 0.01; ***P < 0.001, two-tailed Student’s t test.

