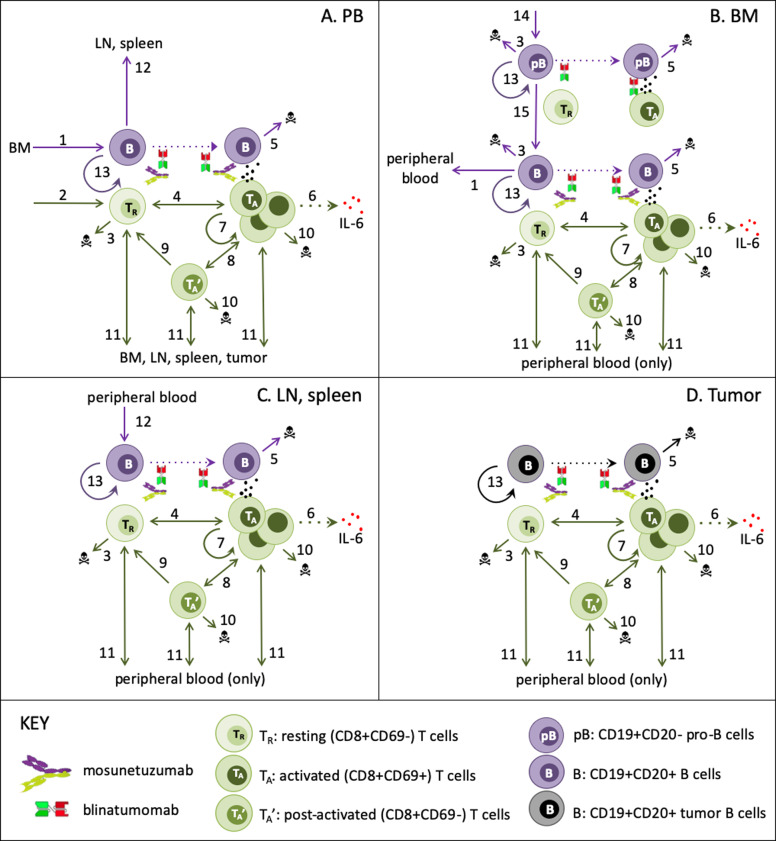
Fig. 1. QSP model schematic of T-cell/B-cell bispecifics.
The QSP model describes the in vivo dynamics of B and T-cells and their interactions in the presence of mosunetuzumab and blinatumomab interactions in the following compartments: a peripheral blood PB, b bone marrow BM, c separate lymph node and spleen compartments, and d an optional NHL tumor compartment. The key biological interactions are labeled in the diagram as follows: (1) migration of newly generated B-cells from BM to PB, (2) Homeostatic thymic generation of new CD8+ T-cells (only when PB T-cells are diminished), (3) homeostatic apoptosis/loss of B-cells (only in BM) and T-cells (only when in excess), (4) T-cell activation due to interaction of bispecific drugs with B and T-cells; for mosunetuzumab, this requires CD20+ B-cells, (5) B-cell death due to T-cell cytolytic activity; for mosunetuzumab, this applies only to CD20+ B-cells, (6) activated T-cell induction of cytokine release, (7) activated T-cell proliferation, (8) interconversion of activated and post-activated T-cells, (9) conversion of post-activated to resting T-cells (e.g., memory cells), (10) activation-related apoptosis of activated and post-activated T-cells, (11) PB T-cell traffic to/from tissues, (12) PB B-cell traffic to replenish normal tissues (only when tissue B-cells are diminished), (13) proliferation of tumor B-cells (constitutive) and normal tissue B-cells (only when diminished), (14) Generation of pro-B-cells from stem cell precursors (15) maturation of CD20- pro-B-cells to CD20+ B-cells. Dotted lines represent mechanisms that do not alter cell states.

