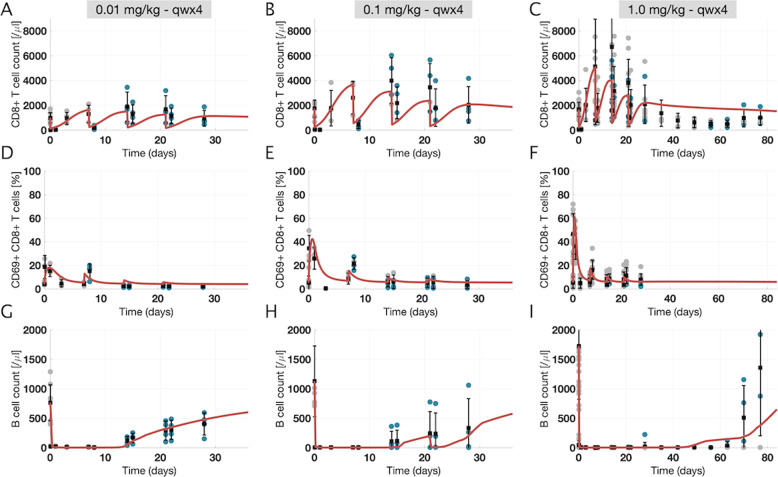
Fig. 3. Time profile data and model fits for peripheral blood pharmacodynamic measurements in the multiple dose study of mosunetuzumab in cynomolgus monkeys (preclinical study 1).
The reference virtual cyno model replicates T and B-cell dynamics in the peripheral blood for different dose levels of mosunetuzumab in cynos. Each column shows a different dose level, ranging from 0.01 to 1 mg/kg given weekly for 4 weeks. Each row shows a measurement in PB (a–c: CD8+ T-cells; d–f: percentage of activated T-cells (CD8+ CD69+ T-cells); and g–i: B-cells). Gray and blue dots show individual ADA− and ADA+ data points, respectively (n = 4 for 0.01 and 0.1 mg/kg; total n = 11 for 1 mg/kg with n = 4 after D29 in the recovery phase), and vertical black lines show mean ± standard deviation. Red curves are the model outputs calibrated to data (reference virtual cyno).

