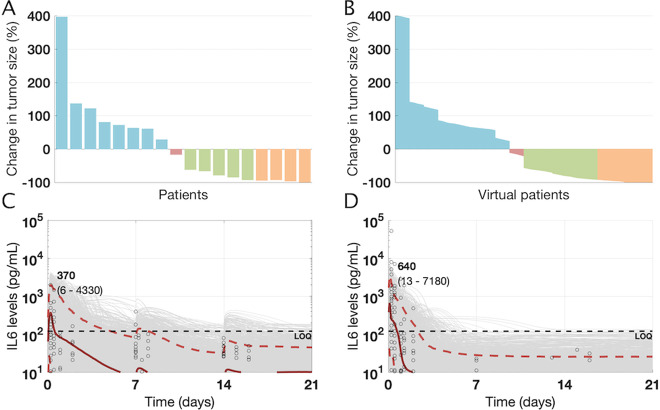
Fig. 4. Clinical data and model outputs for antitumor efficacy and cytokine profiles in DLBCL/NHL patients following treatment with blinatumomab.
a Efficacy data for patients (n = 18) treated with continuous infusion of blinatumomab for 8 weeks using a step-up dosing regimen is shown19. b The overall antitumor efficacy from virtual population of NHL patients (n = 4500 virtual patients) treated with Blinatumomab match the observed clinical data. c, d The cytokine (IL6) levels from34 are digitized and replotted for two cohorts of patients treated with either continuous infusion of blinatumomab using (c) a step-up dose with 5 μg/m2/day for the 1st week, 15 μg/m2/day for the 2nd week and 60 μg/m2/day for the 3rd week or (d) continuous infusion of blinatumomab at 60 μg/m2/day for 3 weeks. The cytokine characteristics of the virtual population of NHL patients was calibrated using the step-up dosing schedule and subsequently validated against the cytokine levels for blinatumomab treatment at 60 μg/m2/day. Black dots show digitized cytokine data (n = 21 for 5/15/60 μg/m2/day; n = 9 for 60 μg/m2/day), gray curves represent individual virtual patients and the red curves represent median, 5, and 95 percentiles for cytokine profiles across the virtual population, consistent with the median and range of measured cytokines. Numbers shown in bold indicate median IL6 peaks whereas numbers shown in parentheses indicate the 5–95 percentile range. Note that it was not technically feasible to digitally capture all the cytokine data/levels that were overlaid at the horizontal line corresponding to 10 pg/mL.

