
Fig. 6. Projected range of first IL6 peaks post mosunetuzumab treatment in NHL patients and comparison with clinical data.
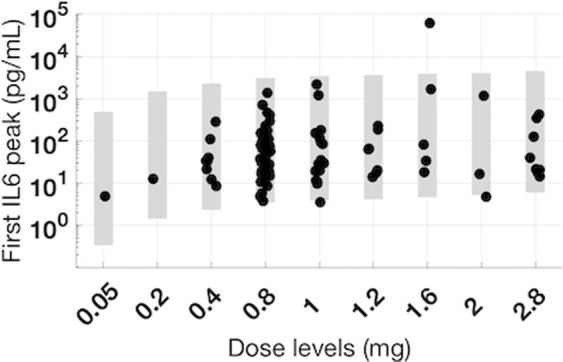
The NHL virtual population was used to project range of clinical IL6 peaks after the first dose of Cycle 1 for a range of clinically tested doses of mosunetuzumab (0.05–2.8 mg). The gray shaded region represents the range of simulated IL6 peak after the first dose of mosunetuzumab was administered. The black dots represent the first IL6 peak in mosunetuzumab Phase 1 clinical data (n = 1, 2, 8, 47, 17, 6, 5, 3, 8 for 0.05, 0.2, 0.4, 0.8, 1, 1.2, 1.6, 2, 2.8 mg, respectively).