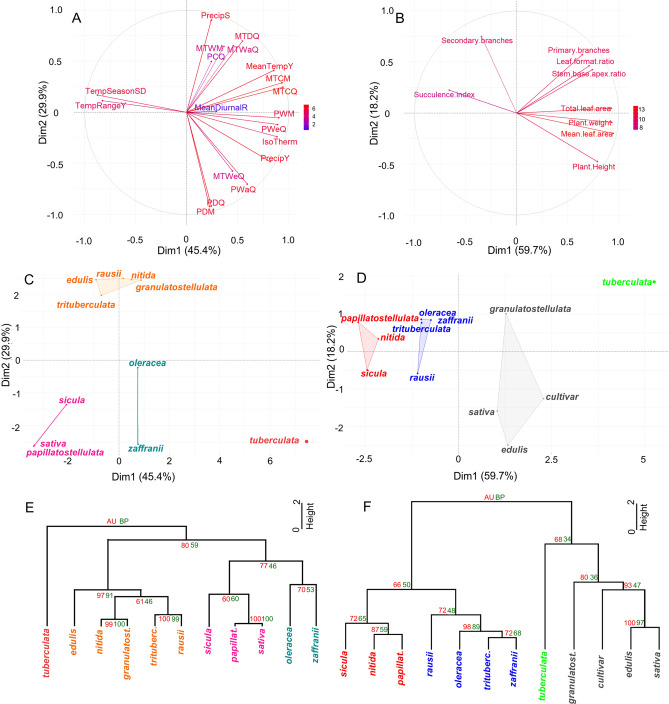
Figure 1.
Characterization of the Portulaca oleracea complex based on climatic and morphometric variables via principal component analysis (PCA) and hierarchical clustering analysis (HCA). (A,B) Variable contribution to each PC. The first two PCs explain 75% and 77% of the variance in A and B, respectively. The color scale indicates the relative variable contribution to each PC. (C,D) Groups of subspecies formed—the first two PCs harbor the most significant correlations to the variables. (E,F) HCA groups subspecies into clusters and values of approximately unbiased (AU) and bootstrap (BP) are presented in red and green, respectively (see Materials and methods section for details). Data for these analyses are presented in Tables S1 and S2. In (A,C,E), the following climatic variables were analyzed: latitude, longitutude, annual mean temperature (MeanTempY), mean diurnal range (MeanDiurnalR), isothermality (IsoTherm), temperature seasonality standard deviation (TempSeasonSD), max. temperature of warmest month (MTWM), min. temperature of coldest month (MTCM), temperature annual range (TempRangeY), mean temperature of wettest quarter (MTWeQ), mean temperature of driest quarter (MTDQ), mean temperature of warmest quarter (MTWaQ), mean temperature of coldest quarter (MTCQ), annual precipitation (PrecipY), precipitation of wettest month (PWM), precipitation of driest month (PDM), precipitation seasonality (PrecipS), precipitation of wettest quarter (PWeQ), precipitation of driest quarter (PDQ), precipitation of warmest quarter (PWaQ), precipitation of coldest quarter (PCQ).

