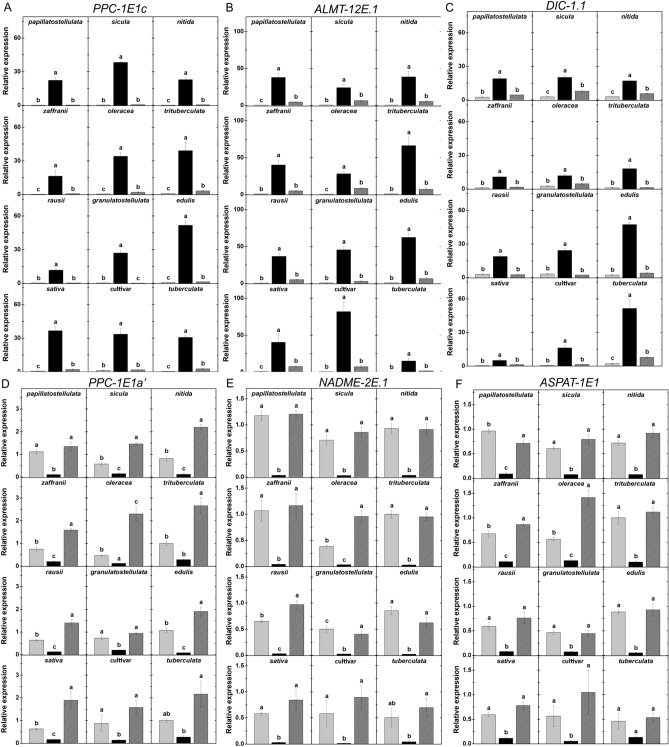
Figure 5.
Impacts of water availability on transcript abundance of C4- and CAM-marker genes. (A-C) Relative abundance of CAM-specific transcripts: PPC1E1c (A), ALMT-12E.1 (B), DIC-1.1 (C). (D–F) Relative abundance of CAM-specific transcripts: PPC1E1a’ (D), NADME-2E.1 (E), ASPAT-1E1 (F). Mean relative expression was normalized against well-watered trituberculata samples, and mRNA levels were determined in samples harvested at dawn (A–C) or dusk (D–F). Data are means ± SE of at least three biological replicates, and different letters indicate statistically significant differences (p < 0.05) among the treatments for each subspecies.

