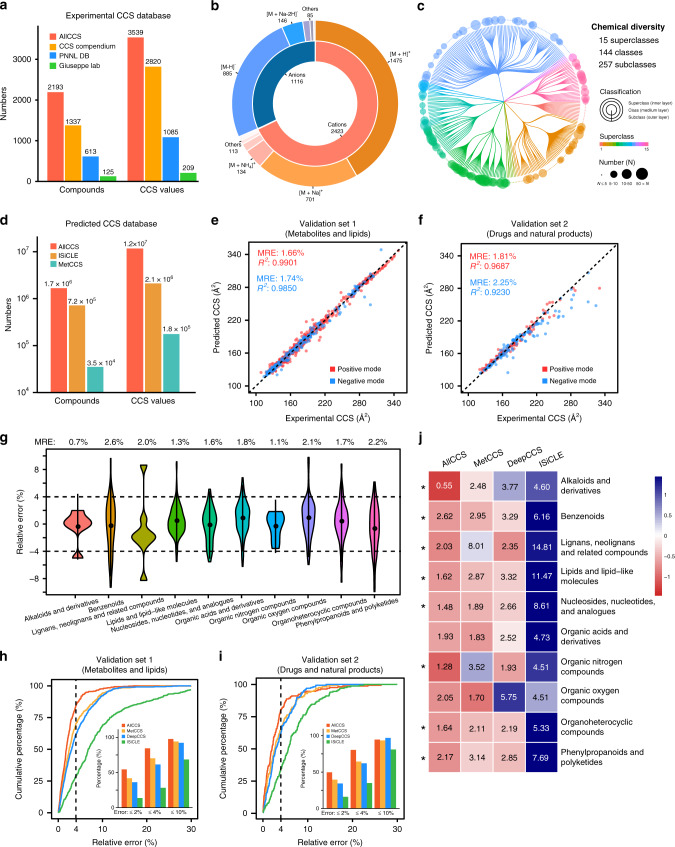
Fig. 2. Unified AllCCS atlas for both experimental and predicted CCS values.
a Statistics of compounds and unified CCS values in AllCCS and other databases12,24,26; b statistics of adduct ions for unified CCS values in AllCCS; c chemical diversity for compounds with unified CCS in AllCCS, which was analyzed using ClassyFire; d statistics of compounds and predicted CCS values in AllCCS and other databases27,31; e, f correlations between predicted and experimental CCS values for external validation sets 1 (e) and 2 (f); g median relative errors (MREs) of predicted CCS values for 10 super classes of chemical structures; h, i cumulative percentages of predicted CCS values with indicated relative errors for external validation sets 1 (h) and 2 (i). The insert bar plot displayed the percentages of predicted CCS values within a certain relative error obtained from different tools; j heat map displaying the comparative prediction errors of ten super classes of chemical structures obtained from different tools; median relative error for each super class is shown in the pane while the color of pane is MRE normalized as Z-score. The symbol “*” represents that AllCCS has the lowest prediction error among these tools. Source data are provided as a Source Data file.

