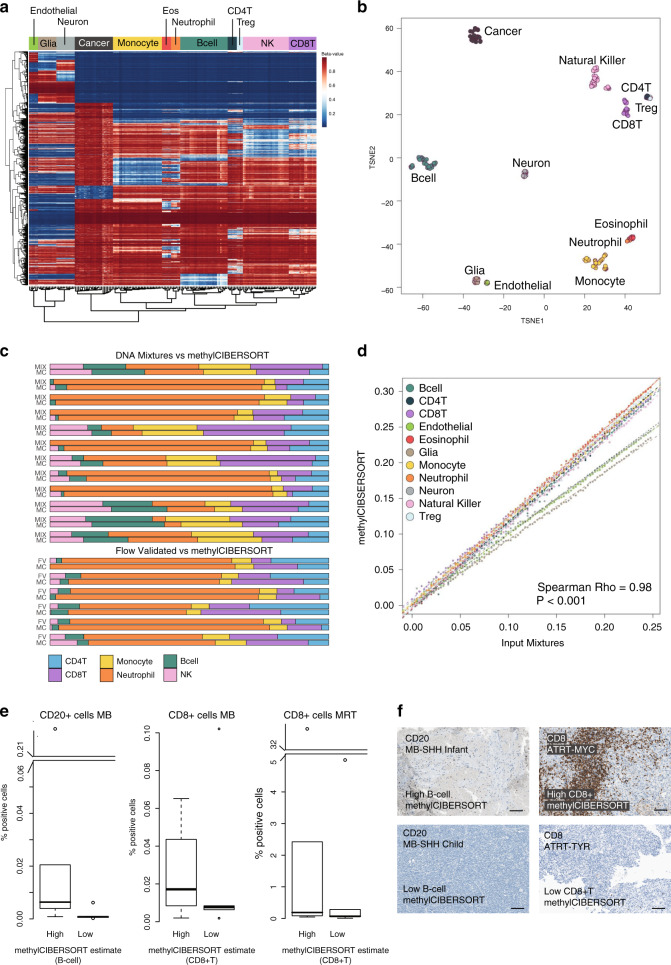
Fig. 1. Generating and benchmarking the signature matrix.
a Heatmap of β-values for CpGs (rows) and samples (columns) used in the methylCIBERSORT signature matrix. Columns/rows are ordered by unsupervised hierarchical clustering which independently resolves reference cell type. b t-SNE plot showing methylation profiles of the pure reference cell types. c Barplot showing the methylCIBERSORT estimates of immune-cell-type proportions (MC) vs. known flow-validated proportions in six control PBMC cell mixtures (FV) or artificial mixtures generated from combined known proportions of isolated immune cell types (MIX). d Scatterplot showing a significant correlation (Pearson, ρ = 0.98, p < 0.001, n = 1100) between known input and methylCIBERSORT estimates of randomly simulated cell mixtures created in silico to contain 75% cancer and known proportions of input cell types. e Boxplots showing results of immunohistochemical (IHC) staining of medulloblastoma (MB) and malignant rhabdoid tumor (MRT) tissue sections with antibodies for CD20 and CD8; n = 30 biologically independent samples. % positive cells are shown by “High” and “Low” categories. “High” represents five samples (for which tissue sections were available) with the highest methylCIBERSORT estimate for either B-cells or CD8+ T-cell infiltration samples. “Low” represents five samples for which a methylCIBERSORT estimation of B-cells or CD8+ T-cell infiltration was 0 or negligible. Discontinuous axes are used where needed to represent outliers. Data represents the % positive cells from a minimum of 15,000 cells assessed per sample (median cells examined = 826,375). Box represents interquartile range, center line represents median, whiskers represent range of minima and maxima excluding outliers, which are represented as points. f Images of IHC staining showing examples from the aforementioned “High” and “Low” categories. Scale bar represents 100 μM.

