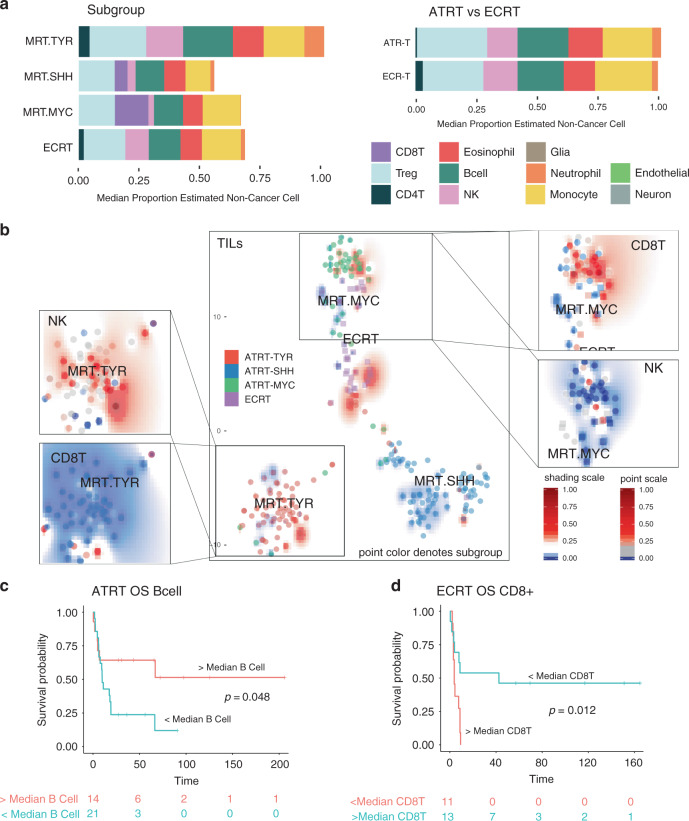
Fig. 4. Deconvolution analysis of malignant rhabdoid tumors immune infiltration.
a Barplots of the estimated median infiltration of specific cell types as a proportion of all non-cancer cell types (range scaled from 0 to 1) in 229 malignant rhabdoid tumors (MRTs) by subgroup (three molecular subgroups originally described by Johann et al.36) and by tumor location. ATRT, atypical teratoid/rhabdoid tumor (within the CNS, i.e., intracranial); ECRT, extra-cranial rhabdoid tumor. b t-SNE plot representing the methylation profiles of 229 MRT. The colors of dots in the central panel map to molecular subgroups (as per Johann et al.36). Text represents centroids of individual subtypes. Background shading represents the 2D spatial density estimation of the amount of tumor-infiltrating lymphocytes (TILs); red shading equals relatively greater than average infiltration and blue less than average. Exploded side panels represent enlarged areas of interest wherein both dot color and background shading represent the relative amount of the particular immune cell infiltration denoted. Red denotes relatively greater than average infiltration and blue less than average. c Kaplan–Meier plot showing significantly different overall survival (OS) in ATRT with > or <median numbers of B-cells; log-rank, p = 0.048, n = 35. d Kaplan–Meier plot showing significantly different overall survival (OS) in ECRT with > or <median numbers of CD8+ T-cells; log-rank, p = 0.012, n = 24.

