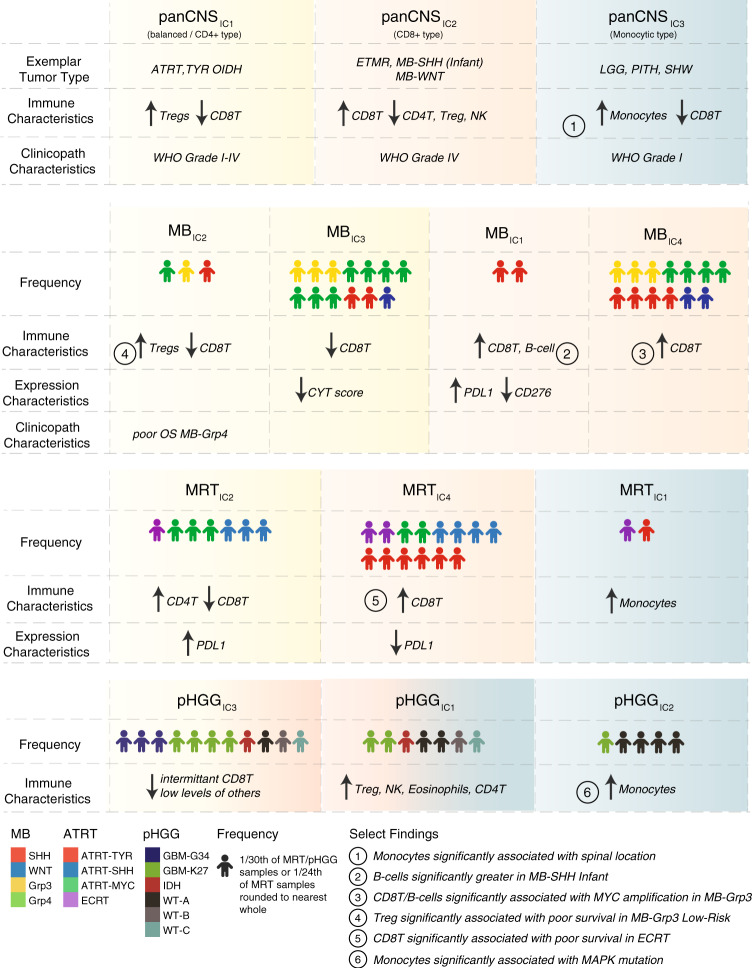
Fig. 6. Summary of immune clusters and associated characteristics.
a Schematic representation of the broadly defining features of immune clusters described in our analysis and a summary of select findings. Icons show the relative frequency of immune cluster membership and the distribution of particular subgroups. Color shading represents broad similarities between the panCNS immune clusters and the more refined tumor type-specific immune clusters. Yellow broadly denotes a pattern of relatively increased CD4+ T infiltration with low–moderate levels of infiltration of other cell types and a lack of CD8+ T, a “balanced/CD4+ type.” Red broadly denotes a pattern of relatively increased CD8+ T infiltration, a “CD8+ type,” and blue broadly denotes a pattern of relatively increased infiltration of monocytes, a “monocytic type”. MRTIC3 is not shown here, as it represents only a small number of patients.

