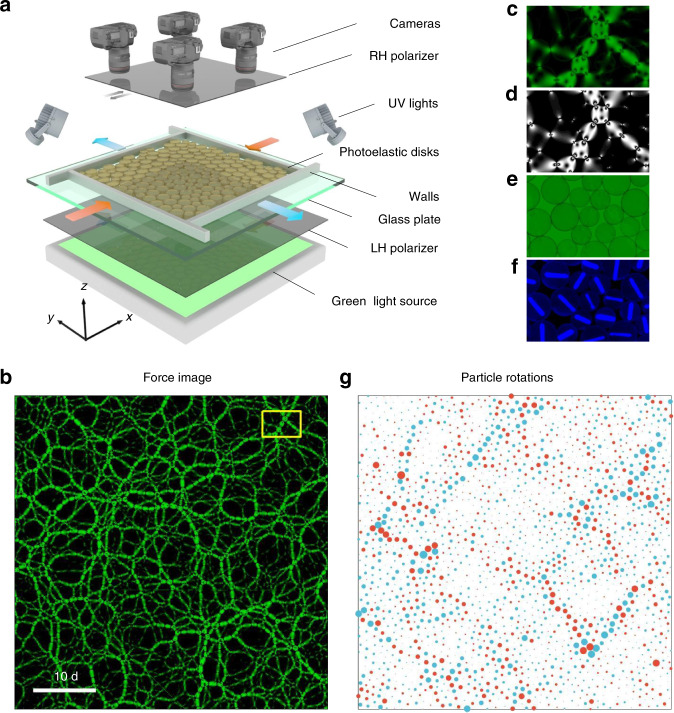
Fig. 1. Schematic of the experimental setup and different types of images recorded.
a Experimental setup. b A snapshot of force chains in an isotropically jammed state (an initial state before shear). A yellow rectangle draws a region that is amplified in c. d A corresponding computer reconstructed image using the measured vector contact forces. e A corresponding normal image of particle configuration. f A corresponding UV image for tracking particle rotations. g Spatial distribution of particle rotations, measured from the initial sate γ = 0 in b to γ = 0.75%. The sizes of red/blue circles are proportional to the magnitudes of counterclockwise/clockwise rotations. Scale bar = 10d, where d = 1 cm, is the diameter of a small particle.

