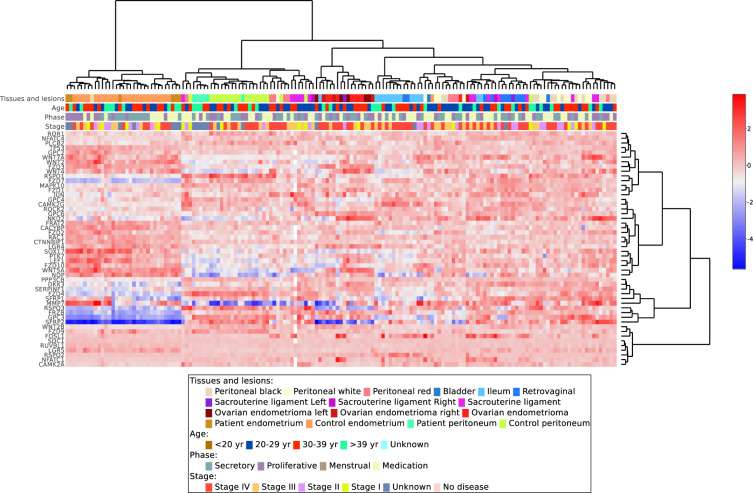
Fig. 3.
Example output of unsupervised hierarchical clustering analysis generated via the EndometDB GUI. Example of unsupervised hierarchical clustering analysis of mRNA expression of the differentially expressed WNT pathway genes (Online-only Table 1) in all the sample groups. The different clinical features of the samples (lesion/tissue type, age of the patients with pre-selected grouping, hormonal stage, and disease stage) are attached to the heatmap. Canberra distance metric with Ward’s clustering method was applied showing clusters corresponding to lesions and tissue types. The dendrogram on the x-axis shows the hierarchical relationship between the tissues and lesion as well as the cycle phase and disease stage. While the dendrogram on the y-axis shows the measure of similarities in the activation levels of the WNT signaling pathway genes. The colors represent different tissues and lesions from both healthy controls and patients.

