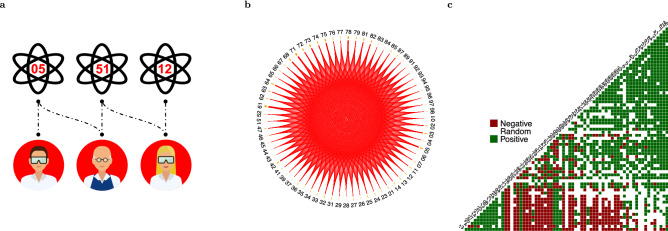
Figure 2.
Diversification patterns. (a) A stylized picture of the original PACS-Authors bipartite network representing scientists’ diversification patterns. (b) The diversification network (the monopartite projection on PACS): links represents the number of scientists active in each pair of sub-fields. (c) Visual summary of the hypergeometric test, providing evidence of the coherent nature of scientists’ diversification choices: 72% of pairs are classified as non-random ( after Bonferroni correction).

