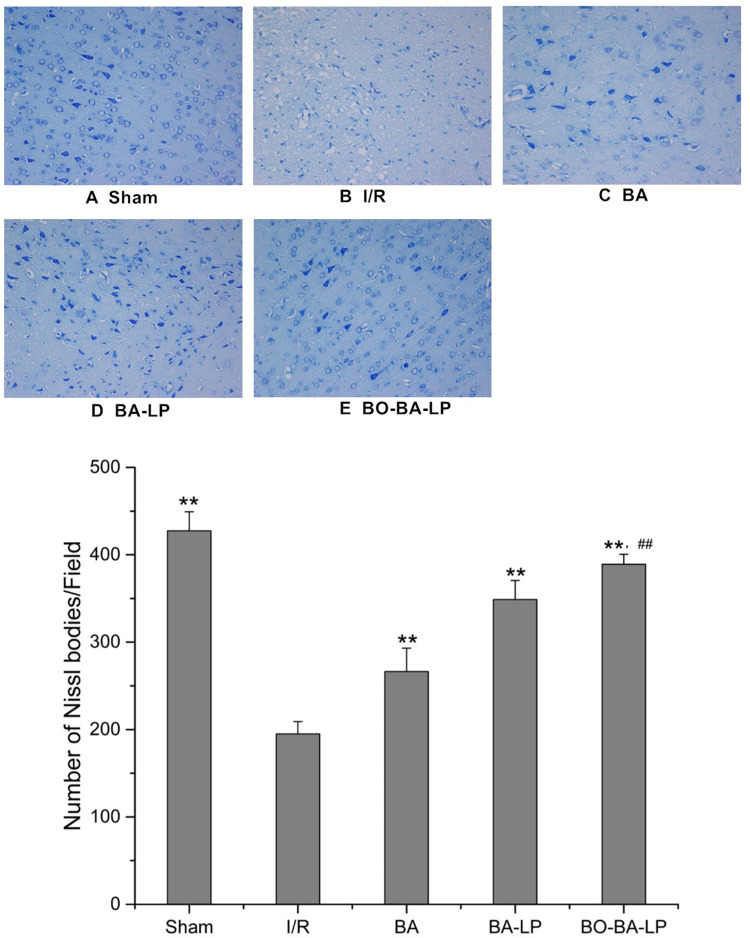
Figure 7.
The Nissl staining of brain tissue slices with the treatment of sham (A), I/R (B), BA group (25 mg/kg, (C), BA-LP group (25 mg/kg; (D) and BO-BA-LP group (25 mg/kg; (E) under 200-fold light microscope. ** Extremely significant different from the I/R group at P < 0.01, ## Extremely significant different from the BA-LP group at P < 0.01.

