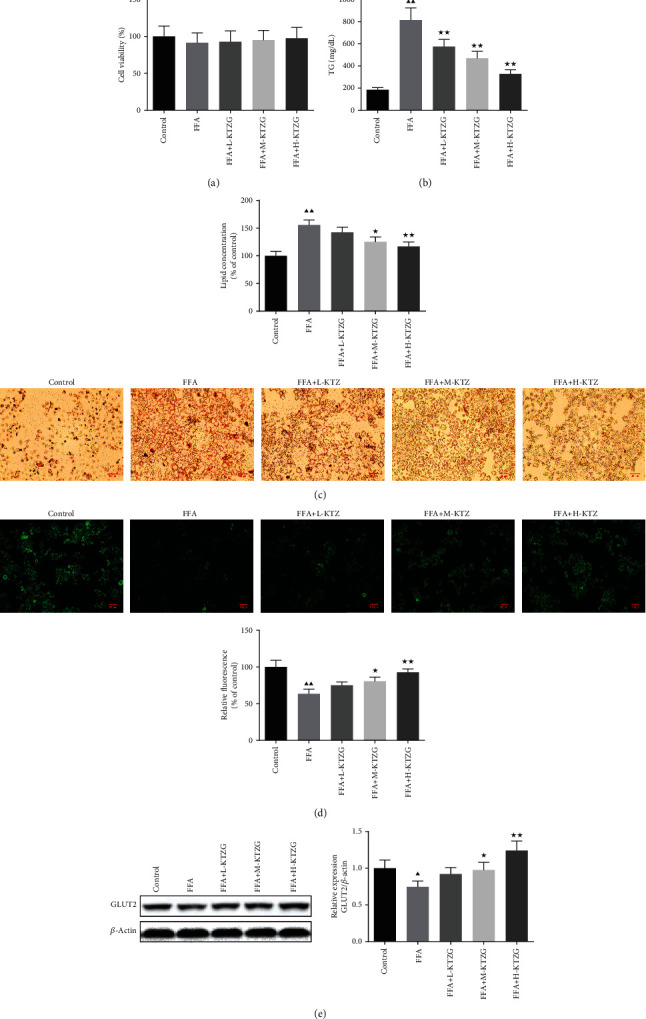
Figure 6.

Effect of KTZG on lipid accumulation and hepatic steatosis in FFA-induced HepG2 cells. (a) MTT assay of the HepG2 cells. HepG2 cells were incubated in KZTG with FFA for 24 h. FFA: free fatty acids. (b) Intracellular TG levels in HepG2 cells treated with KTZG and FFA. (c) Oil red O staining images of HepG2 cells treated with KTZG and FFA (magnification ×200). (d) Effect of KTZG on the glucose uptake in FFA-induced HepG2 cells. (e) Western blotting for GLUT2 in HFD-fed liver tissues treated with KTZG. Compared to control group, ▲P < 0.05, ▲▲P < 0.01; compared to FFA group, ★P < 0.05, ★★P < 0.01.
