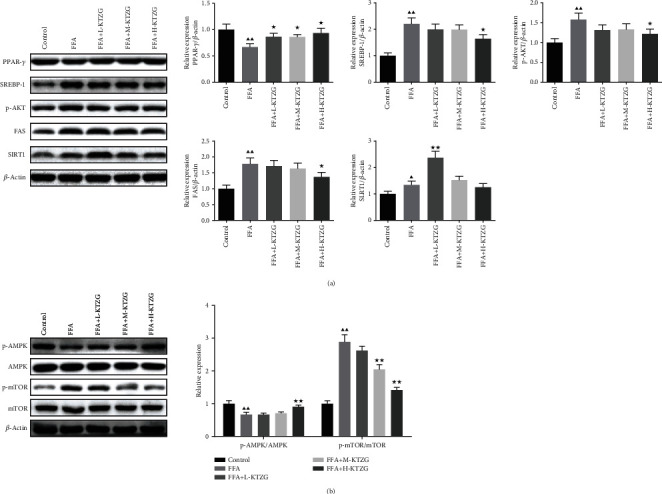
Figure 7.

Effect of KTZG on PPAR-γ, SREBP-1, p-AKT, FAS, SIRT1, and AMPK/mTOR signaling pathway in FFA-induced HepG2 cells. (a) Western blotting for PPAR-γ, SREBP-1, and p-AKT. (b) Western blotting for p-AMPK, AMPK, p-mTOR, and mTOR. Compared to control group, ▲P < 0.05, ▲▲P < 0.01; compared to FFA group, ★P < 0.05, ★★P < 0.01.
