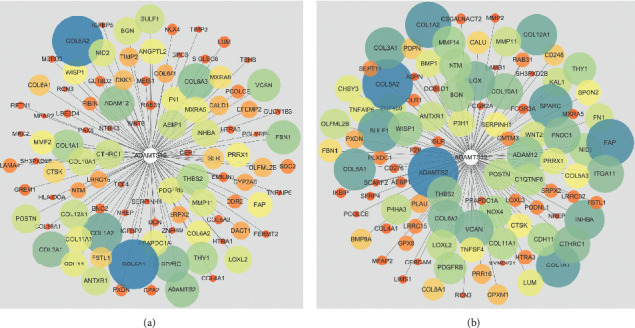
Figure 11.

Coexpression networks. The coexpressed genes of ADAMTS12 in (a) RNA-seq data and (b) chip data. In both network diagrams, color and size represent the degree of correlation, with the blue and large circles depicting a high degree of correlation.
