Figure 2.

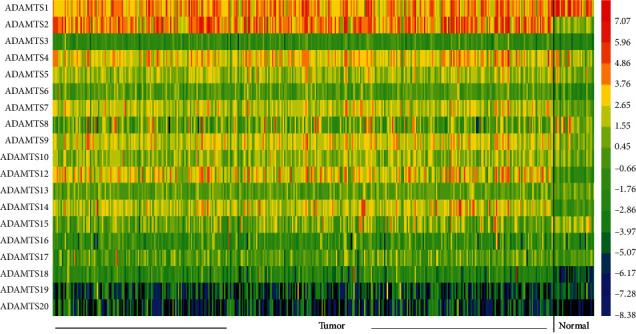
Heatmap depicting the expression of the ADAMTS family in GC patients. Red represents high expression; blue represents low expression; black represents not detected.

Heatmap depicting the expression of the ADAMTS family in GC patients. Red represents high expression; blue represents low expression; black represents not detected.