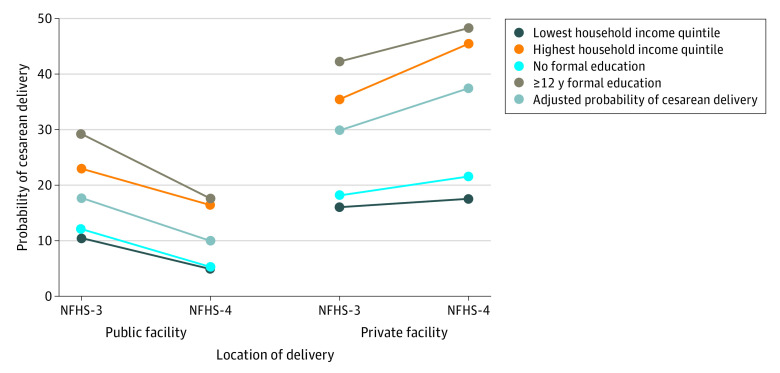
Figure 2. Adjusted Probabilities of Cesarean Delivery by Household Wealth Quintile and Maternal Educational Level.
Based on place of delivery from pooled logistic regression analysis of National Family Health Survey 3 (NFHS-3; 2005-2006) and National Family Health Survey 4 (NFHS-4; 2015-2016). Probabilities are reported as percentages.

