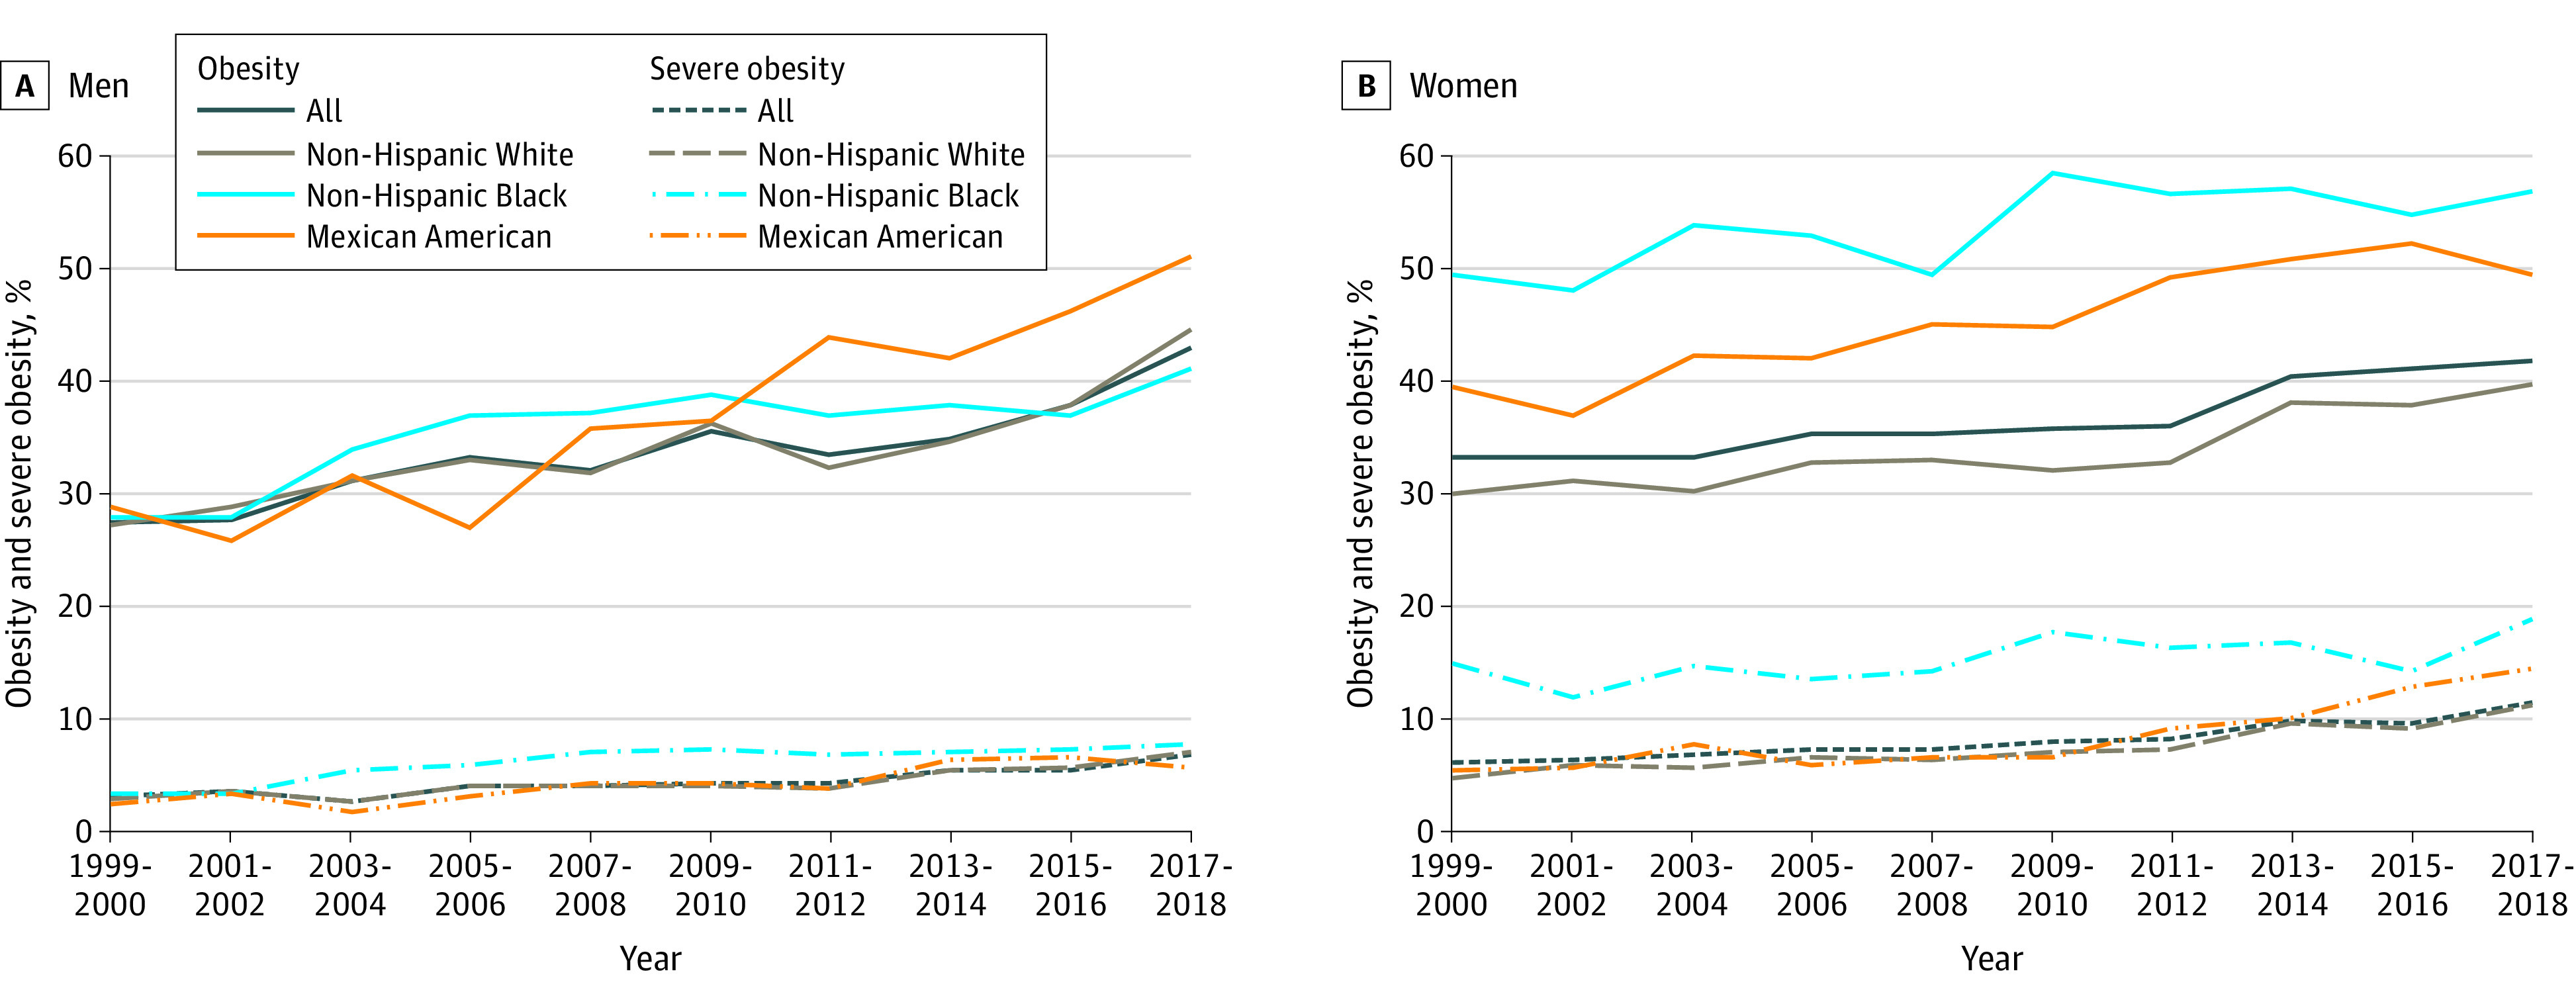
Figure. Age-Adjusted Prevalence of Obesity and Severe Obesity in US Adultsa.

aNational Health and Nutrition Examination Survey data, prevalence estimates are weighted and age-adjusted to the projected 2000 Census population using age groups 20-39, 40-59, and 60 or older. Some estimates are potentially unreliable, due to CI width of more than 5% and relative CI width of more than 130% (severe obesity, non-Hispanic White men 2011-2012; severe obesity, Mexican American men 2001-2002, 2017-2018, and women 2001-2002) or due to fewer than 10 individuals with severe obesity (Mexican American men 2003-2004). The estimate for severe obesity in Mexican American men 2003-2004 was potentially unreliable due to the number of individuals with severe obesity being fewer than 10. Sample size ranges are non-Hispanic White men 879-1395; non-Hispanic Black men 374-662; Mexican American men 266-538; non-Hispanic White women 860-1447; non-Hispanic Black women 422-702; and Mexican American women 237-567. Significant linear trends (P < .001) for all groups except for (1) obesity among non-Hispanic Black men, which increased from 1999-2000 to 2005-2006 (slope, 3.4; 95% CI, 1.8-5.0; P < .001) and then leveled after 2005-2006 (slope, 0.3; 95% CI, −0.6 to 1.2; P = .46; difference in slopes, P = .007); (2) severe obesity among non-Hispanic Black women (P = .02); and (3) severe obesity among Mexican American women, which was level 1999-2000 to 2009-2010 (slope, 0.1; 95% CI, −0.5 to 0.6; P = .81) and increased after 2009-2010 (slope, 2.1; 95% CI, 1.1-3.1; P < .001; difference in slopes, P = .004).
