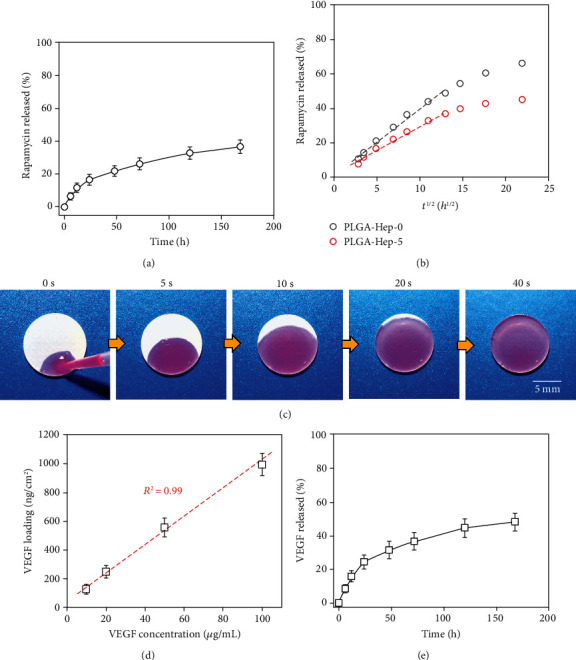
Figure 2.

The loading and release profile of the hierarchical coating. (a) Rapamycin release profile as a function of time. (b) Comparison of rapamycin release with and without spongy top layer, respectively. (c) The wicking action of rhodamine B. (d) Loading of VEGF as a function of VEGF solution concentration. (e) VEGF release profile as a function of time.
