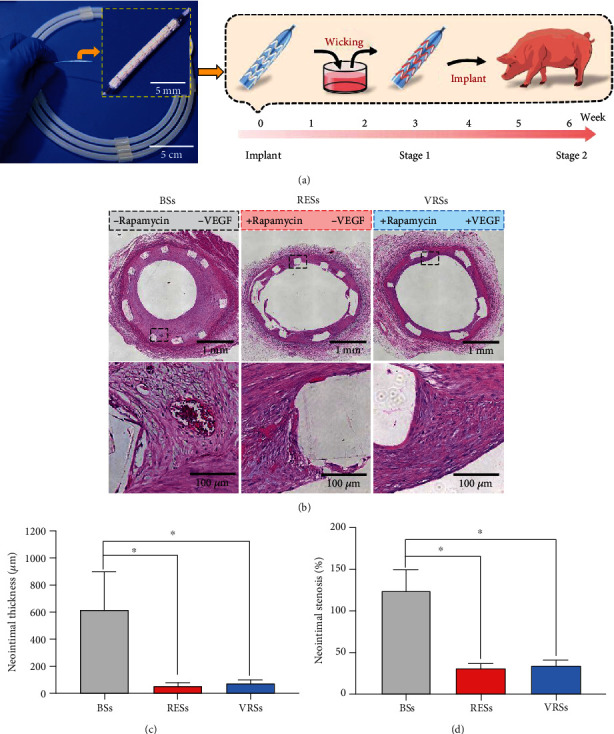
Figure 7.

Histological analysis results at 6 weeks. (a) The digital photos of the stent with a hierarchical coating (left) and the typical wicking process during the surgery (right). (b) The micrographs of the H&E-stained cross-section slices of the arteries with BSs, RESs, and VRSs, respectively. Histological analysis of neointimal thickness (c), and the percentage of neointimal stenosis (d) (n = 3, ∗P < 0.05).
