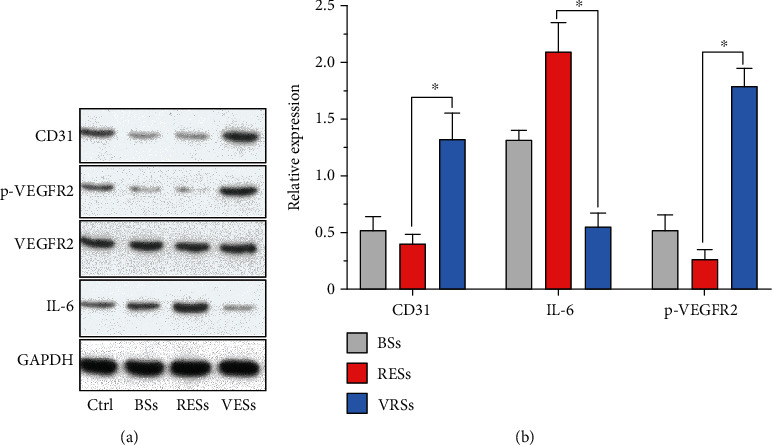
Figure 9.

(a) Western blot analysis of arterial segments implanted with BSs, RESs, and VRSs, respectively. Ctrl represents the native arterial segments. (b) Quantification of Western blot bands. Values normalized to GAPDH and then normalized to Ctrl (n = 3, ∗P < 0.05).
