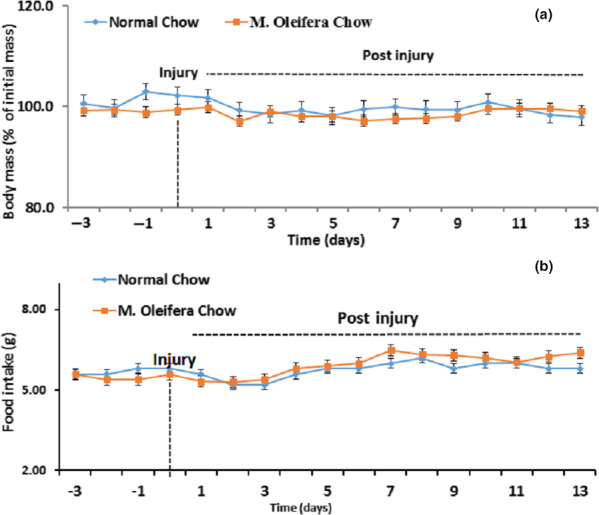
FIGURE 1.

Effect of Moringa oleifera on body mass and food intake. (a): Time course of body mass in mice fed on normal chow (blue line, n = 5) and M. oleifera chow group (orange line, n = 5). Independent Student's t‐test showed the nonsignificant effect of time, nonsignificant effects of diet on the body mass. The statistical analysis is given as p = .421 at p = .005, SD = 3.74, SEM = 1.67 for normal chow group and p = p = .421 at p = .005, SD = 2.40, SEM = 1.07 for M. oleifera chow group with the confidence interval of 0.811–9.98. (b): Time course of body mass in mice fed on normal chow (blue line, n = 5) and M. Oleifera chow group (orange line, n = 5). Independent Student's t‐test showed the nonsignificant effect of time, nonsignificant effects of diet on food consumption. The statistical analysis at p = .005 is p = .300, SD = 2.74, SEM = 2.7 for normal chow group and p = .300, SD = 3.40, SEM = 5.0 for Moringa oleifera chow group with the confidence interval of 0.211–9.78
