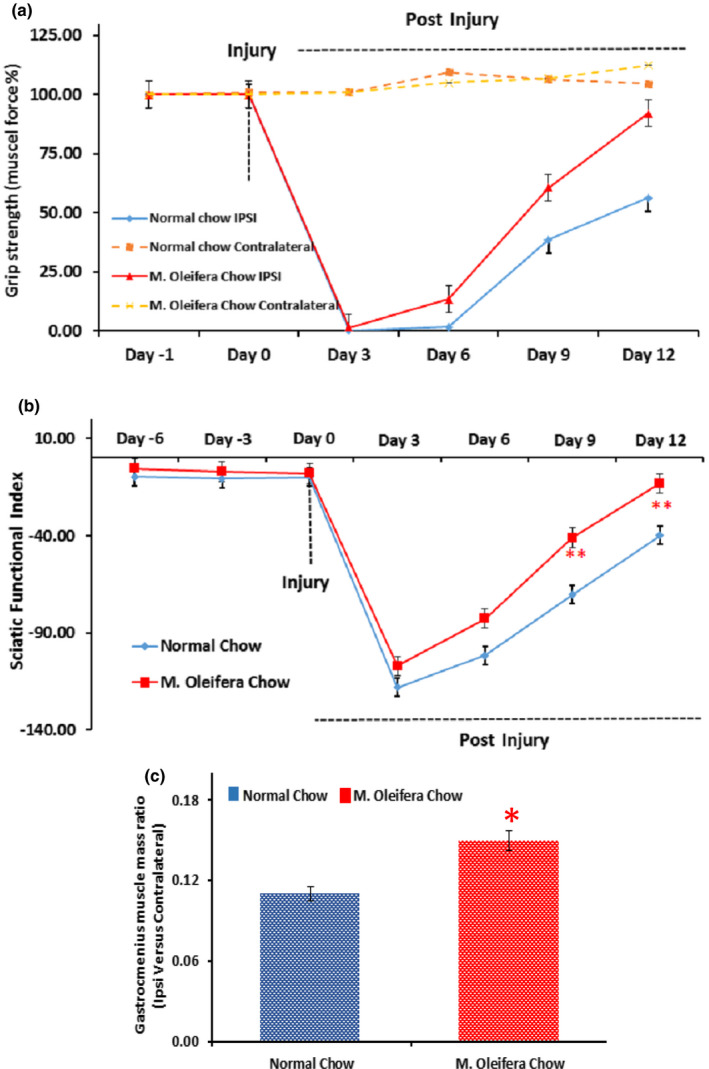
FIGURE 2.

Effect of Moringa oleifera on motor functional recovery. (a): Time course of muscle grip strength (% of initial force) in mice fed on normal chow group (blue line, n = 5) and mice fed on M. oleifera chow group (red line, n = 5) after sciatic nerve crush. Measurements were acquired from both hind limbs as Ipsilateral (solid lines) and contralateral (dotted lines) to the mechanical insult of the sciatic nerve. Independent Student's t‐test showed a significant effect of time, significant effects of diet on muscle grip strength force. The statistical analysis is given as p = .002 at p = .005, SD = 9.34, SEM = 10.67 for normal chow group and p = p = **.002 at p = .005, SD = 4.40, SEM = 2.07 for M. oleifera chow group with the confidence interval of 18.811–10.98. (b) Time course of Sciatic functional index (SFI) in mice fed on normal chow group (blue line, n = 5) and mice fed on M. oleifera chow group (red line, n = 5). Measurements were acquired from both hind limbs as ipsilateral and contralateral to the mechanical insult of sciatic nerve. Independent Student's t‐test showed significant effect of time, significant effect of diet on SFI. The statistical analysis is given as p = **.029 at p = .005, SD = 10.54, SEM = 4.71 for normal chow group and p = **.029 at p = .005, SD = 11.29, SEM = 5.04 for M. oleifera chow group with the confidence interval of −34.08 to −2.37. (c): Time course of muscle mass restoration in mice fed on normal chow group (blue bar n = 5) and mice fed on M. oleifera chow group (red bar n = 5). Measurements were acquired from both hind limbs as Ipsilateral and contralateral (muscle mass ratio of both legs) to the mechanical insult of the sciatic nerve. Independent Student's t‐test showed a significant effect of time and a significant effect of diet on muscle mass restoration. The statistical analysis is given as p = *.04 at p = .005, SD = 1.54, SEM = 3.41 for normal chow group and p = *.04 at p = .005, SD = 1.29, SEM = 9.4 for M. Oleifera chow group with the confidence interval of 12.08 to −5.47
