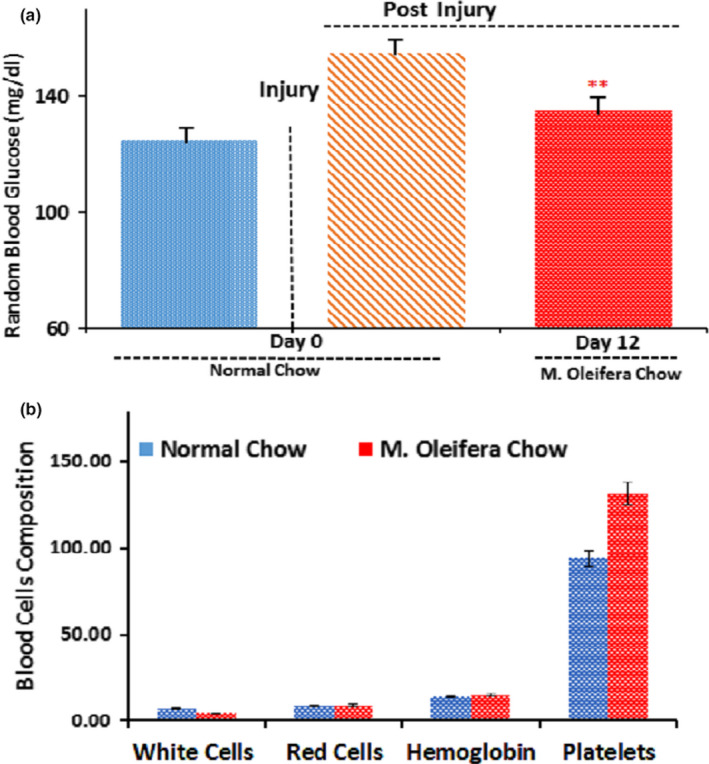
FIGURE 4.

Effect of Moringa oleifera on blood glucose and blood cell composition. (a): Random blood glucose levels in mice fed on normal chow group (blue bar, n = 5) and mice fed on M. oleifera chow group (red bar, n = 5) after sciatic nerve crush. Independent Student's t‐test showed a significant effect of time, significant effects of diet on blood glucose levels. A significant difference was found between both groups as p = .003, SD = 4.53, SEM = 2.7 for M. Oleifera chow group with the confidence interval of 10.00–5.054. (b): Blood composition of both groups, normal chow group (n = 5) and M. oleifera chow group (n = 5). The 1st set of bars shows white blood cells level (103 μl) of both groups; statistically nonsignificant at (p = .161), 2nd set of bars show red blood cells level (106 μl) of both groups; statistically nonsignificant at (p = .386), 3rd set of bars show hemoglobin level (g/dl) of both groups; statistically nonsignificant at (p = .408), and 4th set of bars show platelets level (103 μl) of both groups; statistically nonsignificant at (p = .455)
