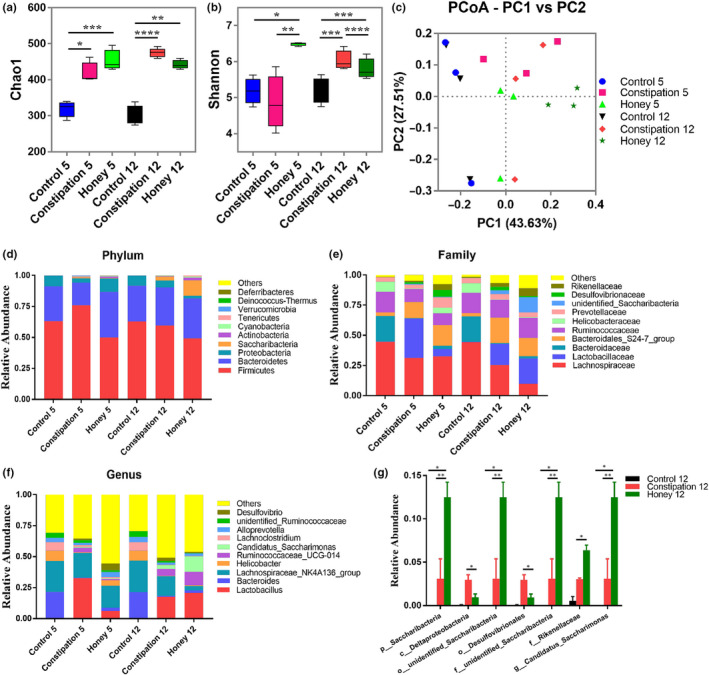
FIGURE 3.

Structural comparison of fecal microbiota among three groups. (a) Comparison of the Chao 1 index of different groups. (b) The Shannon index was used to estimate diversity of the fecal microbiota among the three groups. (c) Plots shown were generated using the weighted UniFrac‐based PCoA. PC1 and PC2 account for 71.14% of the variation. (d–f) The relative abundance of microbial community in different mice groups at phylum, family, and genus levels among the three groups. (g) The relative abundance of bacterial groups on day 12 between groups tested by means of one‐way ANOVA followed by Tukey's test. *p < .05; **p < .01; ***p < .001; ****p < .0001
