FIGURE 5.

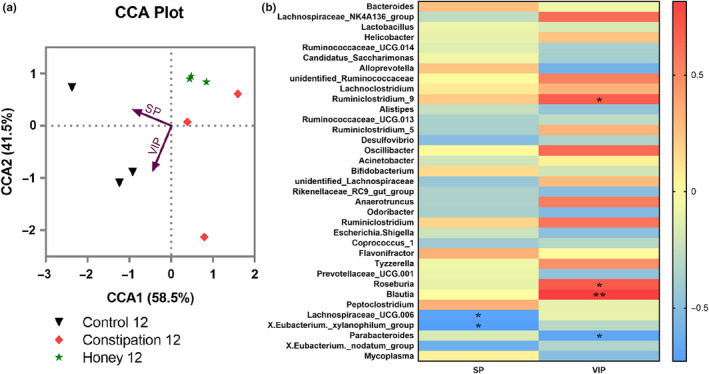
The correlation between intestinal bacterial groups and neurotransmitters. (a) Canonical correlation analysis (CCA) analysis. Arrows represent the variables substance P (SP) and vasoactive intestinal peptide (VIP) and indicate the direction and magnitude of the variables associated with bacterial community structure. (b) The correlation between the relative abundance of different microbial groups at genus level and the levels of SP and VIP was tested by the Spearman correlation method. The positive correlation was displayed as correlation value >0, and the negative correlation was displayed as correlation value <0; statistically significant correlation was displayed as *p < .05; **p < .01
