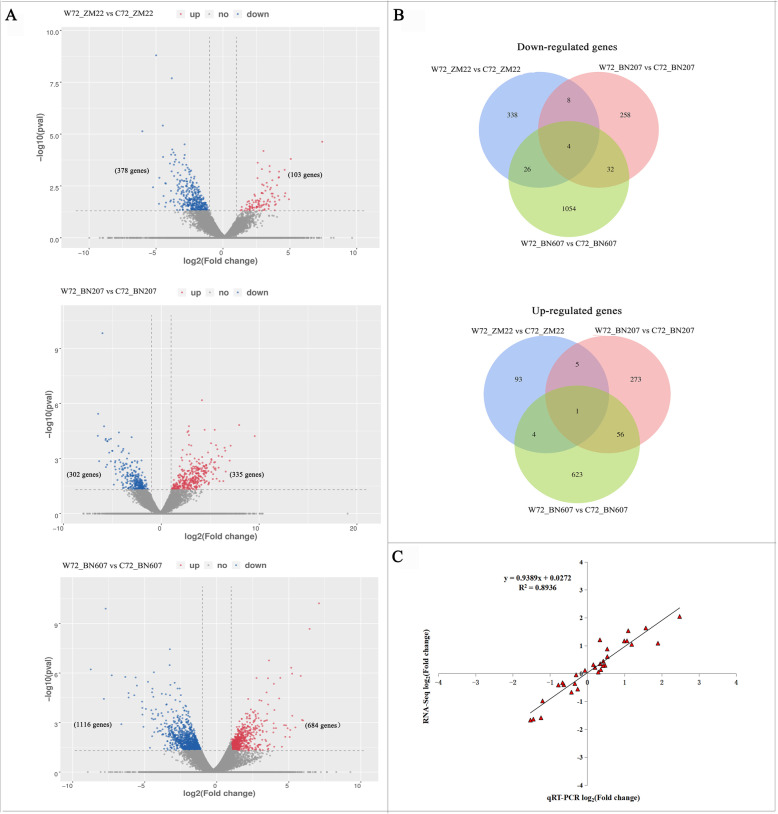
Fig. 3.
Analysis of DEGs in three wheat cultivars under waterlogging stress. a. Volcano plot analysis of DEGs in ZM22, BN206 and BN607. The abscissa represents the log2 (fold change), and -log2 (p-value) is shown as the ordinate. The red colour indicates significantly upregulated DEGs, the blue colour showed the significantly downregulated DEGs, and the grey colour represents nonsignificant DEGs. b. Venn diagram of downregulated and upregulated genes in ZM22, BN206 and BN607. c. Correlation analysis of the qRT-PCR data and the RNA sequencing results. W72_ZM22, W72_BN207 and W72_BN607 refer to ZM22, BN207 and BN607 under the waterlogging treatment, respectively. C72_ZM22, C72_BN207 and C72_BN607 refer to ZM22, BN207 and BN607 under the control treatment, respectively

