
Fig. 2.
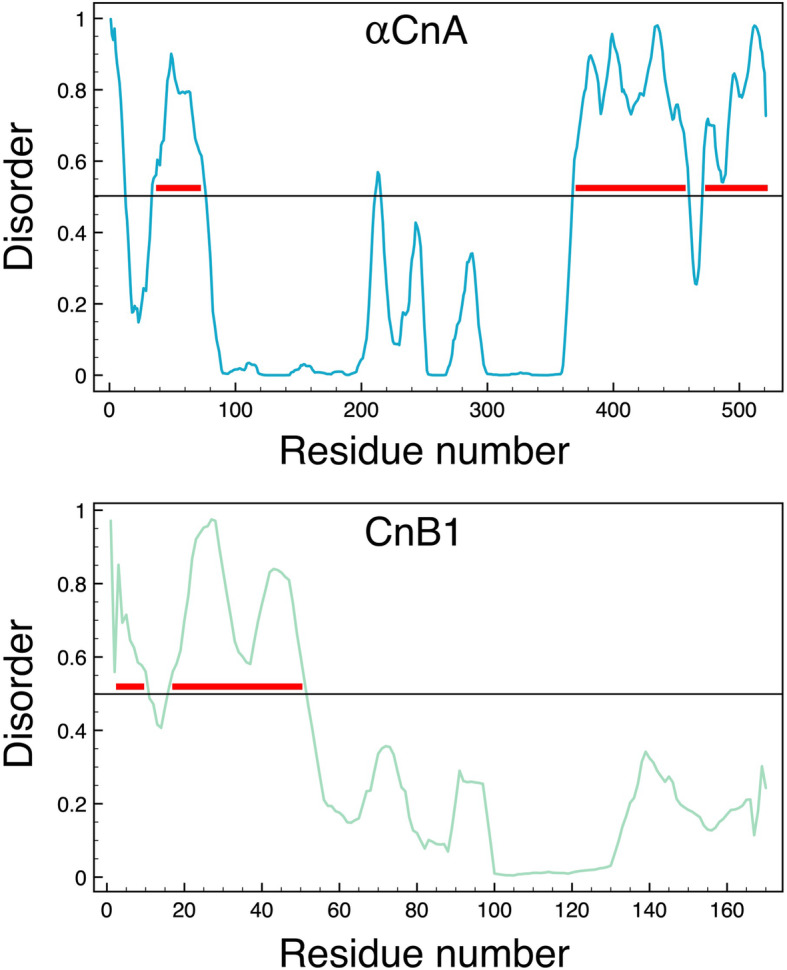
Disorder predictions for the human αCnA (top panel) and CnB1 (bottom panel) chains. Values above 0.5 denote predicted disorder. Major regions of predicted disordered are marked with red bars
Official websites use .gov
A
.gov website belongs to an official
government organization in the United States.
Secure .gov websites use HTTPS
A lock (
) or https:// means you've safely
connected to the .gov website. Share sensitive
information only on official, secure websites.
Disorder predictions for the human αCnA (top panel) and CnB1 (bottom panel) chains. Values above 0.5 denote predicted disorder. Major regions of predicted disordered are marked with red bars