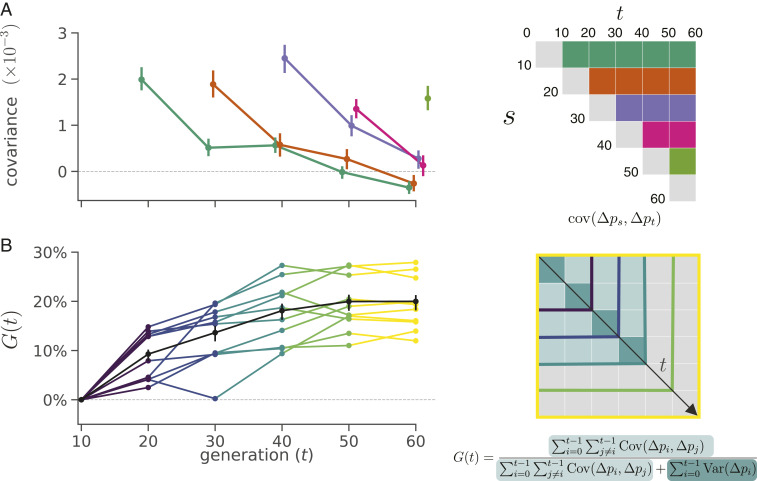
Fig. 1.
(A) Temporal covariance, averaged across all 10 replicate populations, through time from the Barghi et al. (33) study. Each line depicts the temporal covariance from some reference generation to a later time , which varies along the x axis; each line corresponds to a row of the triangle of the temporal covariance matrix with the same color (Right). The ranges around each point are block bootstrap CIs. (B) A lower bound on the proportion of the total variance in allele frequency change explained by linked selection, , as it varies through time along the x axis. The black line is the averaged across replicates, with the block bootstrap CI. The other lines are the for each individual replicate, with colors indicating what subset of the temporal covariance matrix in Right is being included in the calculation of .

