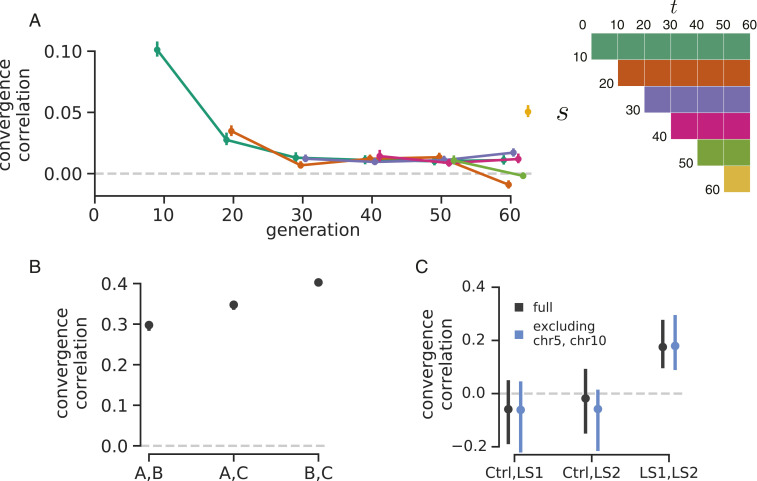
Fig. 2.
(A) The convergence correlations, averaged across Barghi et al. (33) replicate pairs, through time. Each line represents the convergence correlation from a starting reference generation to a later time , which varies along the x axis; each line corresponds to a row of the temporal convergence correlation matrix depicted on Right (where the diagonal elements represent the convergence correlations between the same time points across replicate populations). We note that convergent correlation for the last time point is an outlier; we are unsure as to the cause of this (e.g., it does not appear to be driven by a single pair of replicates). (B) The convergence correlations between individual pairs of replicates in the Kelly and Hughes (38) data (note that the CIs are plotted but are small on this y-axis scale). (C) The convergence correlations between individual pairs of replicates in the data from Castro et al. (39) for the two selection lines (LS1 and LS2) and the control (Ctrl); gray CIs are those using the complete dataset, and blue CIs exclude chromosome 5 (chr5) and chr10, which harbor the two regions Castro et al. (39) found to have signals of parallel selection between LS1 and LS2. Through simulations, we have found that the differences in convergence correlation CI widths between these Drosophila studies and the Longshanks study are due to the differing population sizes.

