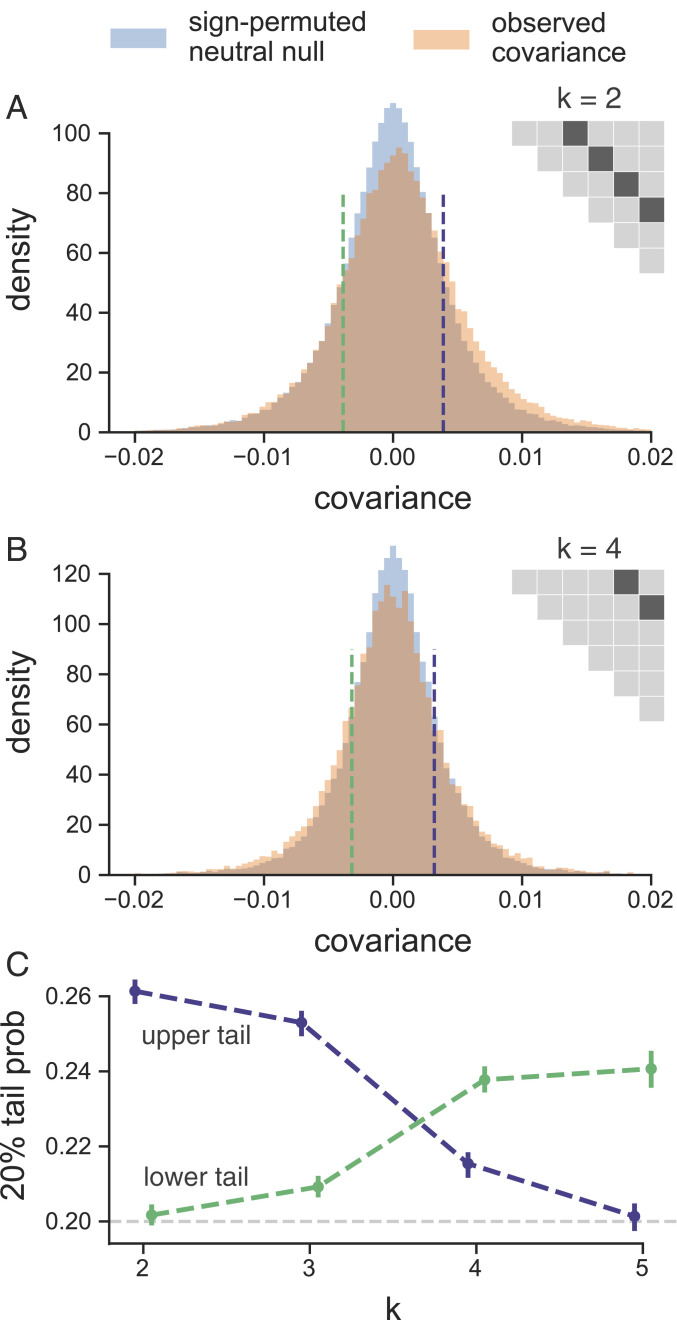
Fig. 3.
(A and B) The distribution of temporal covariances calculated in 100-kb genomic windows from the Barghi et al. (33) study plotted alongside an empirical neutral null distribution created by recalculating the windowed covariances on 1,000 sign permutations of allele frequency changes within tiles. The number of histogram bins is 88, chosen by cross-validation (SI Appendix, Fig. S25). In A, windowed covariances are separated by generations, and in A, the covariances are separated by generations; each is an off diagonal from the variance diagonal of the temporal covariance matrix (cartoon of upper triangle of covariance matrix in A and B, where the first diagonal is the variance, and the dark gray indicates which off diagonal of the covariance matrix is plotted in the histograms). (C) The lower and upper tail probabilities of the observed windowed covariances, at 20 and 80% quintiles of the empirical neutral null distribution, for varying time between allele frequency changes (i.e., which off diagonal ). The CIs are block bootstrap CIs, and the light gray dashed line indicates the 20% tail probability expected under the neutral null. Similar figures for different values of are in SI Appendix, Fig. S27.

