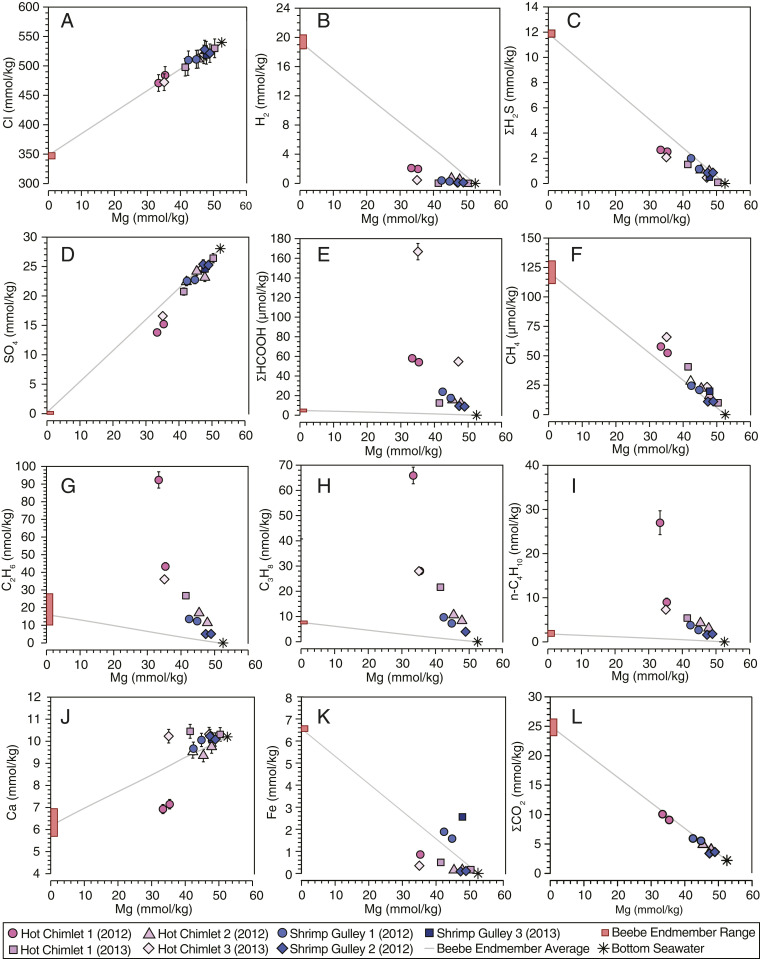
Fig. 1.
Measured concentrations of aqueous Mg versus aqueous Cl (A), H2 (B), ΣH2S (C), SO4 (D), ΣHCOOH (E), CH4 (F), C2H6 (G), C3H8 (H), n-C4H10 (I), Ca (J), Fe (K), and ΣCO2 (L) for mixed fluids sampled at the Piccard vent field in 2012 and 2013. For each species, the range in extrapolated zero-Mg high-temperature endmember composition is shown with the red bar along the y axis, and the average is shown with a gray line projected from seawater composition. Species that exhibit conservative behavior during mixing plot on the line, while species that behave nonconservatively plot above or below the line. The 2s errors are shown (or are smaller than the symbols).

