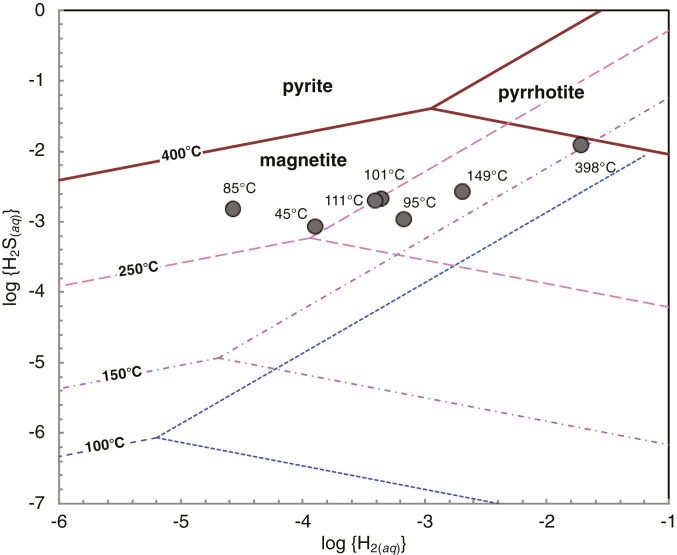
Fig. 2.
Activity diagram showing phase relations in the chemical system Fe–S–O–H at 400, 250, 150, and 100 °C and 500 bar. The symbols indicate measured H2(aq) and H2S(aq) concentrations in Piccard vent fluids. Requisite thermodynamic data for the construction of the diagram were calculated using SUPCRT92 computer code (56) and corrected for the nonstoichiometric composition of pyrrhotite in equilibrium with pyrite (57).

