Fig. 3.
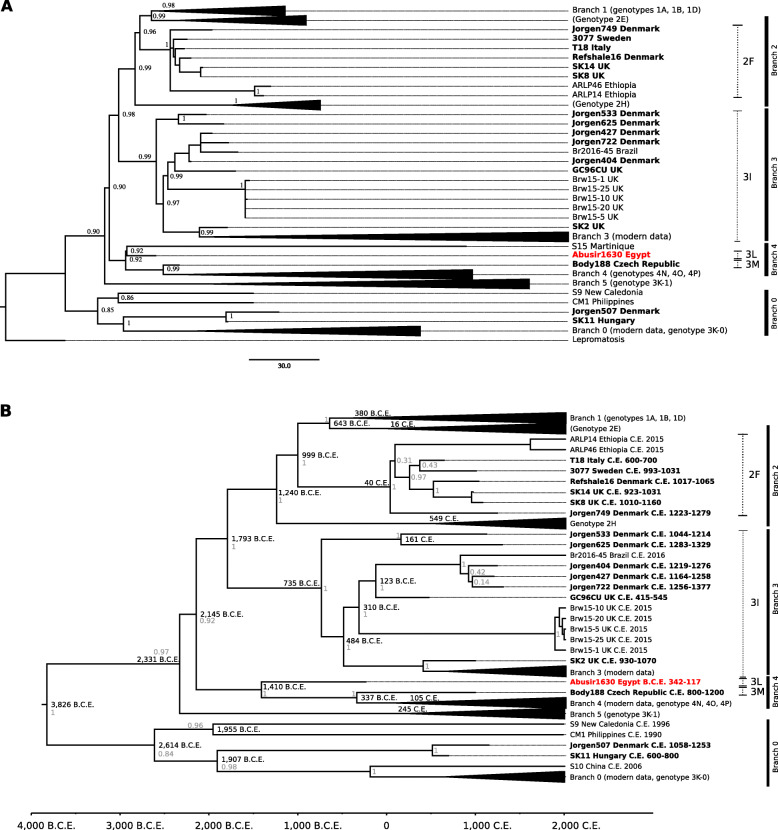
Phylogenetic trees of M. leprae genomes. a Maximum parsimony tree reconstructed from 3342 informative SNP positions based on 170 M. leprae strains [52–61]. The tree is drawn to scale and branch length represents the number of substitutions. M. lepromatosis was used as an outgroup. Ancient strains are labeled in bold, and the newly added strain Abusir1630 is labeled in red. Bootstrap values (1000BS) are presented as node labels. Some subtypes are collapsed to simplify the figure. The genotypes are written in brackets or marked with dotted lines. The branches are given on the right side with black bars. b Dated Bayesian Maximum Clade Credibility tree reconstructed using 2641 informative SNP positions from 161 M. leprae samples [52–61] (without outgroup), strict molecular clock and Bayesian Skyline model. Ancient samples [52–54] are bolded, the newly added genome Abusir1630 in red. The node labels are the median divergence times in years B.C.E. and C.E. The posterior values are given in gray. The genotypes are written in brackets or marked with dotted lines. The branches are given on the right side with black bars

