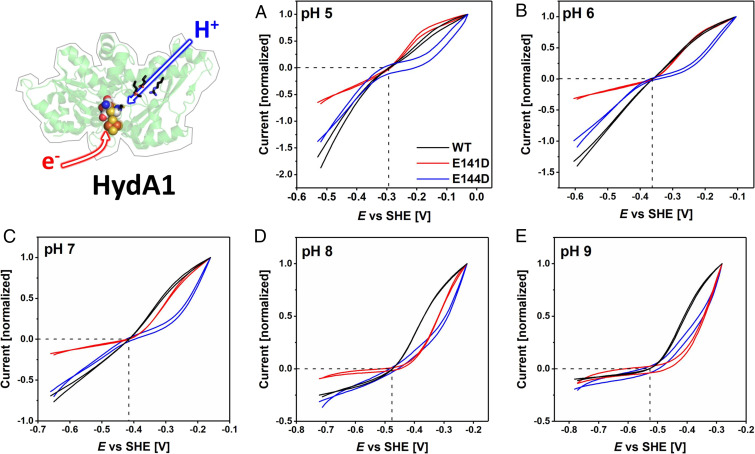
Fig. 4.
Comparisons of electrocatalytic H2 oxidation and H+ reduction for WT CrHydA1 and variants E141DCrHydA1 (red) and E144DCrHydA1 (blue) from pH 5 to pH 9 (A–E, respectively), presented after normalizing to the H2 oxidation current recorded at an H2 oxidation overpotential of 0.25 V. Note that relative current densities do not reflect absolute enzyme activities. The crossing point of the dashed lines represents the 2H+/H2 thermodynamic potential. Experimental conditions as for Fig. 3.

