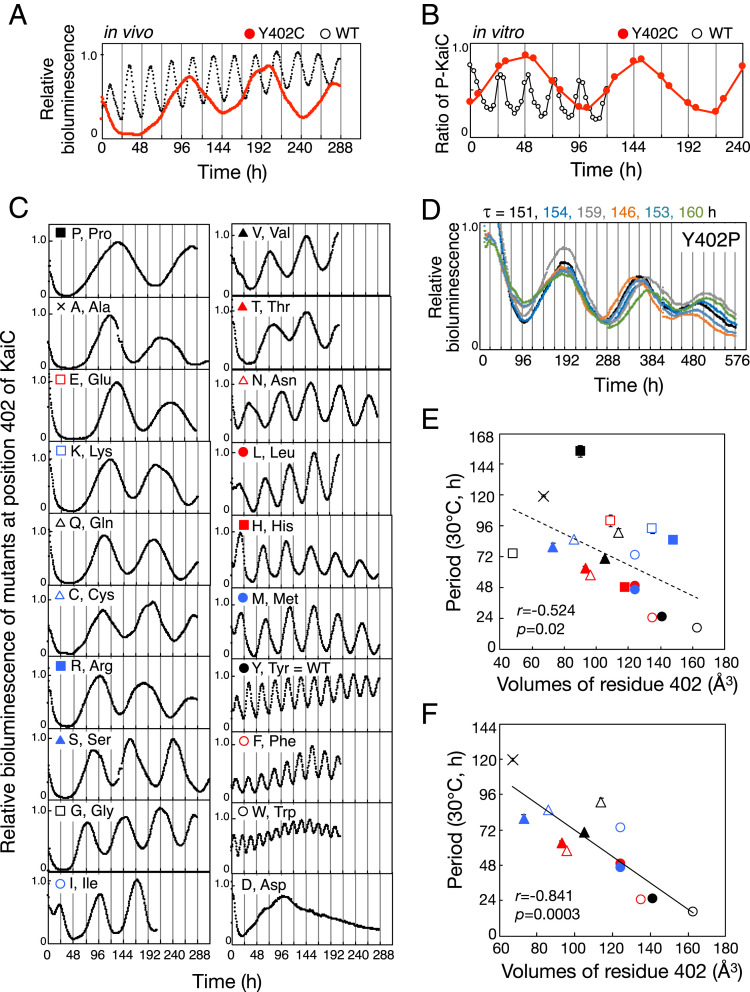
Fig. 1.
Aberrant circadian rhythms of mutants at position 402 of KaiC. (A) Representative bioluminescence rhythms of Y402C (red circles) and WT (black circles) at 30 °C. (B) Representative in vitro phosphorylation rhythm of Y402C (black circles) and WT (gray circles). KaiC protein was incubated at 30 °C in the presence of KaiA and KaiB, and aliquots of reaction mixtures were collected every 3 h (WT) or twice a day (Y402C). (C) Representative bioluminescence rhythms of the indicated KaiC mutants of Tyr402 at 30 °C. Data are shown in the order of period lengths. (D) Six independent measurements of bioluminescence rhythms and periods (τ) of Y402P at 30 °C. (E) Periods of bioluminescence rhythms of cyanobacteria with all possible amino acid substitutions at residue 402 of KaiC, plotted against van der Waals volumes of residue 402. Y402D is not shown because it was arrhythmic. (F) Periods of bioluminescence rhythms of cyanobacteria with uncharged amino acids other than proline and glycine at residue 402 of KaiC, plotted against van der Waals volumes of residue 402. Symbols are as in C. Values are represented as means ± SD. The sample sizes (n) are shown in SI Appendix, Table S1. r, correlation coefficient. p, P value. To determine period, peak times after 48 h (Y402P, Y402A, Y402E, Y402K, Y402Q, Y402C, Y402R, Y402S, Y402G, Y402I, Y402V, Y402T, Y402N, Y402L, Y402H, and Y402M) were used for the analysis to reject unstable peaks during the first 2 d.

