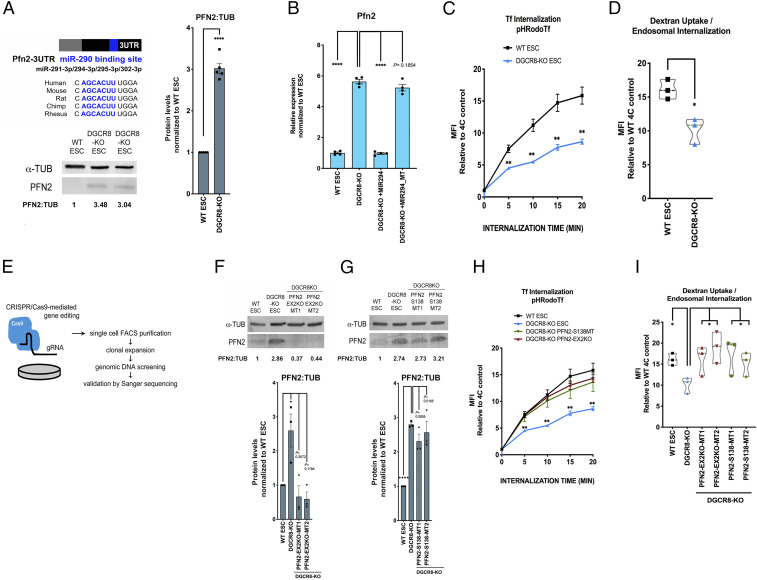
Fig. 1.
MicroRNAs regulate endocytosis through their inhibition of Pfn2 in pluripotent stem cells. (A, Upper Left) Schematic depicting the Pfn2 3′ UTR with the conserved miR-290–binding site highlighted in blue. (A, Lower Left) Western blot analysis of endogenous PFN2 in v6.5 (WT) and Dgcr8-KO ESCs. A representative image is shown. (A, Right) Summary quantification of five independent Western blot analyses. Error bars represent SEM. ****P < 0.0001, unpaired two-tailed t test. (B) qRT-PCR analysis of Pfn2 expression in WT ESCs, Dgcr8-KO ESCs, and Dgcr8-KO ESCs with addback of miR-294 mimic (+MIR294) or miR-294 mimic with mutant seed (MIR294_MT). n = 4 independent experiments. Error bars represent SEM. ****P < 0.0001, unpaired two-tailed t test. (C) pH-labeled transferrin endosomal uptake assay in WT and Dgcr8-KO ESCs over the indicated times, as measured by the change in mean fluorescence intensity (MFI) relative to control. n = 3 independent experiments. Medium, serum+LIF. Error bars represent SEM. **P < 0.01, unpaired two-tailed t test. (D) pH-labeled dextran endosomal uptake assay in WT and Dgcr8-KO ESCs, measured by the change in MFI relative to control. n = 3 independent experiments. Medium, serum+LIF. Data are shown as median ± quartiles. *P < 0.05, unpaired two-tailed t test. (E) Schematic representation of CRISPR/Cas9-mediated gene editing strategy to generate Pfn2 mutant ESC lines. (F, Top) Western blot analysis of PFN2 expression in WT ESCs, Dgcr8-KO ESCs, and two clones (MT1 and MT2) of Pfn2-EX2KO (in Dgcr8-KO background) ESCs. A representative image is shown. (F, Bottom) Summary quantification of Western blot data. n = 3 or more independent experiments. (G, Top) Western blot analysis of PFN2 expression in WT ESCs, Dgcr8-KO ESCs, and two clones (MT1 and MT2) of Pfn2-S138 (in Dgcr8-KO background) ESCs. A representative image is shown. (G, Bottom) Summary quantification of Western blot data. n = 3 or more independent experiments. (H) pH-labeled transferrin endosomal uptake assay in WT, Dgcr8-KO +/− Pfn2-EX2KO or Pfn2-S138 ESCs over the indicated times, as measured by the change in MFI relative to control. n = 3 independent experiments. Medium, serum+LIF. Error bars represent SEM. **P < 0.01, unpaired two-tailed t test. (I) pH-labeled dextran endosomal uptake assay in WT, Dgcr8-KO +/− Pfn2-EX2KO, and Pfn2-S138 ESCs as measured by change in MFI relative to control. n = 3 independent experiments. Medium, serum+LIF. Data are shown as median ± quartiles. *P < 0.05, unpaired two-tailed t test. Scanned images of unprocessed blots are shown in SI Appendix, Fig. S6.

