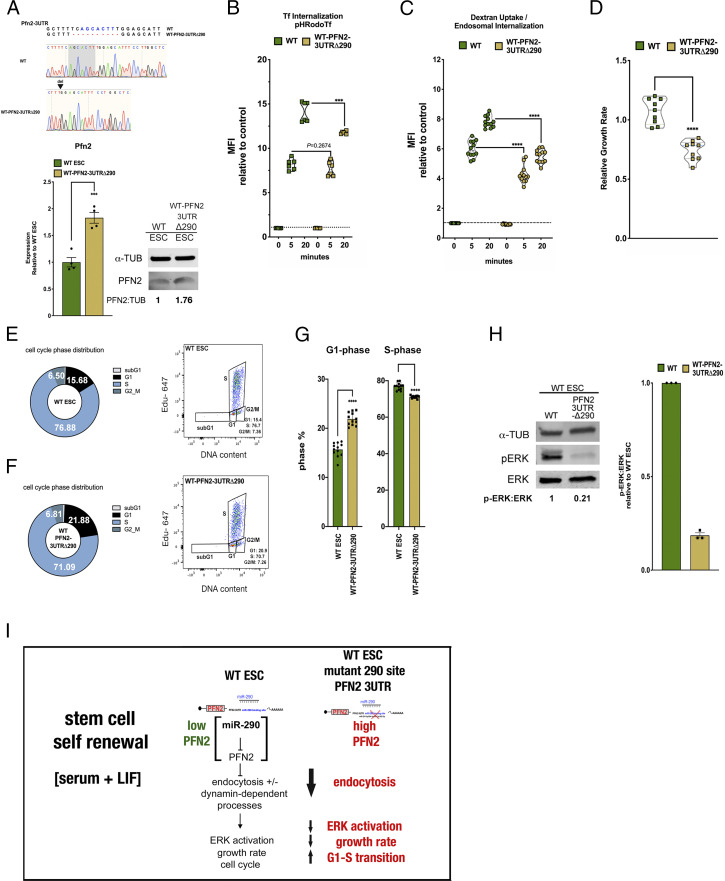
Fig. 5.
Deletion of a single miR-290 seed site in ESCs recapitulates defects seen in Dgcr8-KO ESCs. (A, Top) Sanger sequencing results showing CRISPR-induced mutations to the Pfn2 3′ UTR miR-290 seed site in WT ESCs. (A, Bottom Left) qRT-PCR analysis of Pfn2 expression in WT and WT-Pfn2-3UTRΔ290 mutant ESCs. n = 4 independent experiments. Error bars represent SEM. ***P < 0.001, unpaired two-tailed t test. (A, Bottom Right) Western blot analysis of protein levels in WT and WT-Pfn2-3UTRΔ290 mutant ESCs. (B) pH-labeled transferrin endosomal uptake assay in WT and WT-Pfn2-3UTRΔ290 mutant ESCs over the indicated times, as measured by change in MFI relative to control. n = 3 independent experiments. Medium, serum+LIF. Error bars represent SEM. ***P < 0.001, unpaired two-tailed t test. (C) pH-labeled dextran endosomal uptake assay in WT and WT-Pfn2-3UTRΔ290 mutant ESCs, measured by change in MFI relative to control. n = 3 independent experiments. Medium,serum + LIF. Data are shown as median ± quartiles. ****P < 0.0001, unpaired two-tailed t test. (D) Growth rates of indicated WT-Pfn2-3UTRΔ290 mutant ESCs relative to WT ESCs under the indicated conditions. n = 3 independent experiments. Medium, serum+LIF. Data are shown as median ± quartiles. ****P < 0.0001, unpaired two-tailed t test. (E and F) Mean cell cycle phase distribution of the indicated ESC sample (Left) and representative dot plot depicting dual Click-iT–based EdU and FxCycle DNA content analysis of the indicated ESC sample (Right) from three independent experiments. (G) Summary statistics of G1 phase distribution (Left) and S-phase distribution (Right) from three independent experiments. Error bars represent SEM. ****P < 0.0001, unpaired two-tailed t test. (H) Intracellular phospho-ERK protein levels relative to ERK protein levels in WT and WT-Pfn2-3UTRΔ290 mutant ESCs relative to naïve conditions over the indicated time course. n = 3 independent experiments. Data are shown as median ± quartiles. Error bars represent SEM. *P < 0.05; ****P < 0.0001, unpaired two-tailed t test. (I) Schematic summarizing the effect of miR-294–dependent target PFN2 on stem cell self-renewal state in WT and Dgcr8-KO ESCs. Scanned images of unprocessed blots are shown in SI Appendix, Fig. S6.

