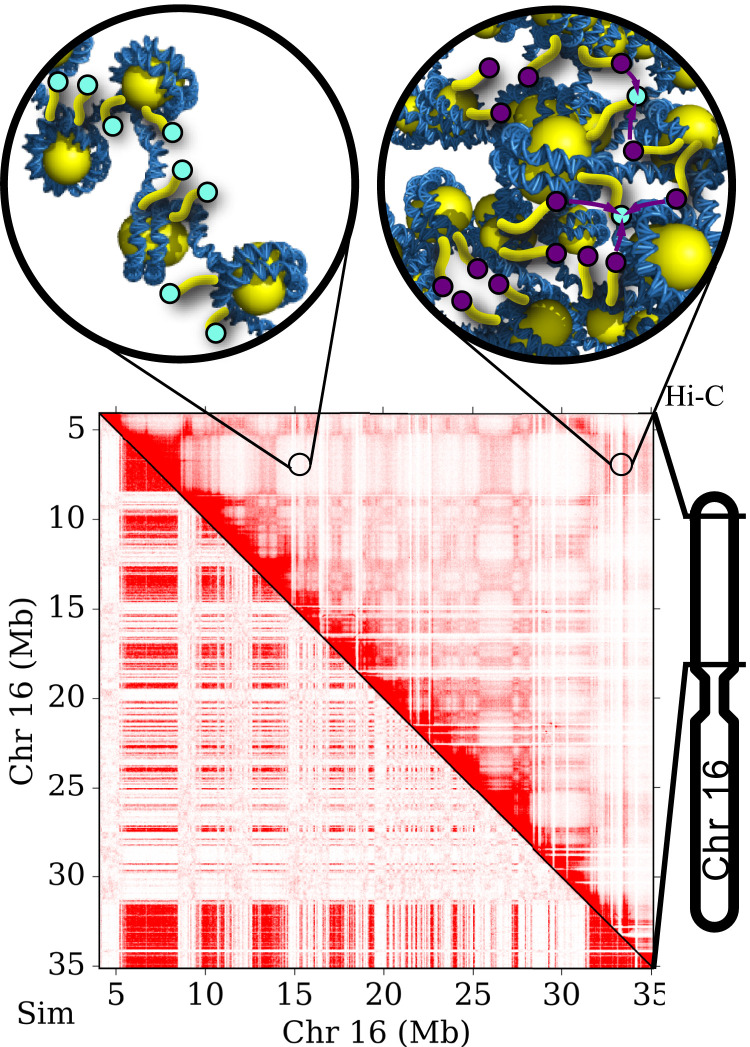
Fig. 1.
(Top) Images demonstrate the degree of chromosomal compaction in euchromatin (Left) and heterochromatin (Right). Cyan and purple circles represent histone tails that are unmethylated and methylated, respectively. (Bottom) Image shows results from Hi-C experiments (16, 17) (upper-right triangle) compared with our physical model for chromosomal organization (lower-left triangle) (22). Chromosome compartments within the Hi-C contact map indicate segregation into heterochromatin and euchromatin.

