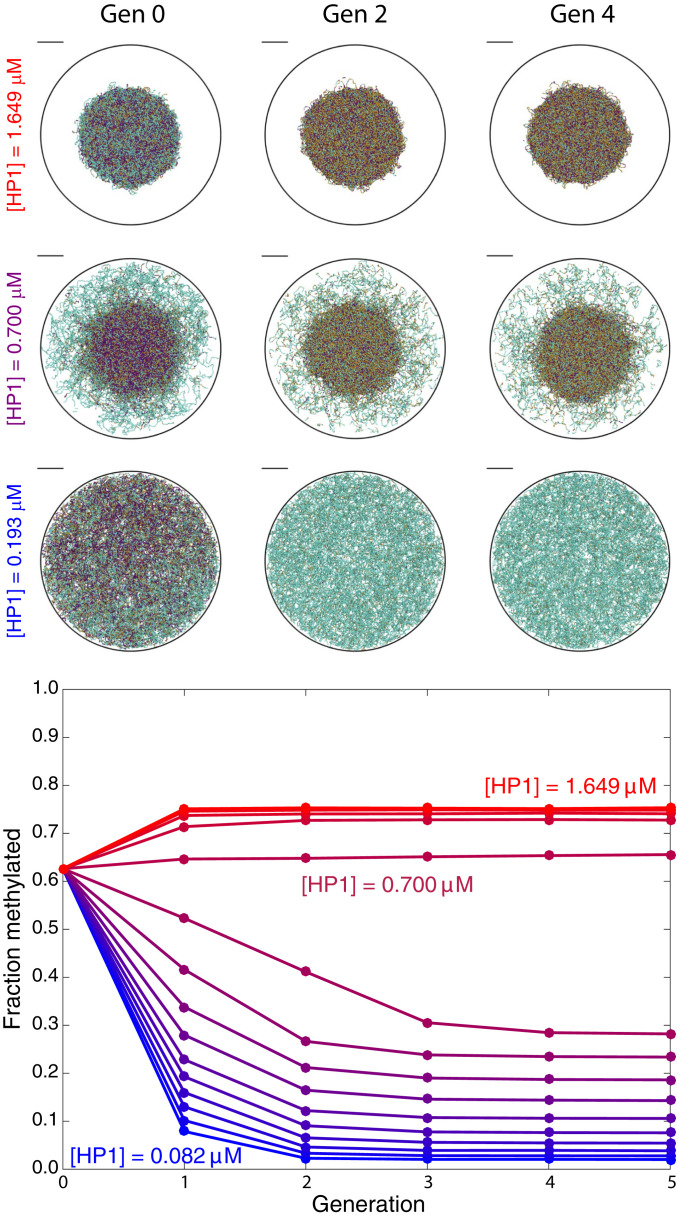
Fig. 2.
(Top) Images show representative configurations of the chromatin structure at generations 0, 2, and 4 for three concentrations of HP1. (Scale bars, .) Cyan, gold, and purple colors designate nucleosomes that are unmethylated at both histone tails, methylated at one tail, and methylated at both tails, respectively. (Bottom) Plot shows the fraction of methylated nucleosomes versus generation of methylation conferral for a range of free HP1 concentrations from (blue) to (red).

