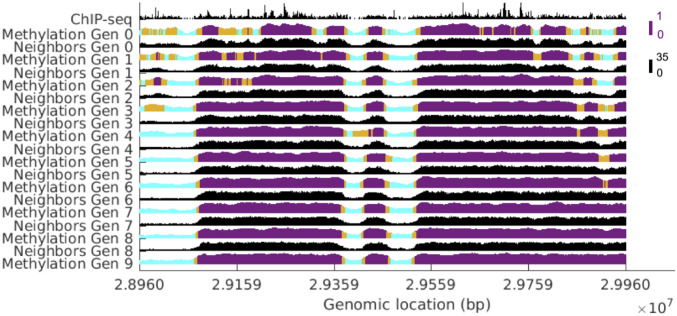
Fig. 3.
The evolution of the methylation profile and number of neighbors for a subsection of the chromosome at the optimal concentration of HP1. The height of the methylation profile corresponds to the fraction of methylated nucleosomes in the surrounding window of 101 nucleosomes. The color represents the compaction state of the nucleosome as predicted by the window fraction methylated and cutoffs established from Fig. 5. Cyan, gold, and purple colors designate nucleosomes that are in euchromatin, boundary between euchromatin/heterochromatin, and heterochromatin, respectively.

