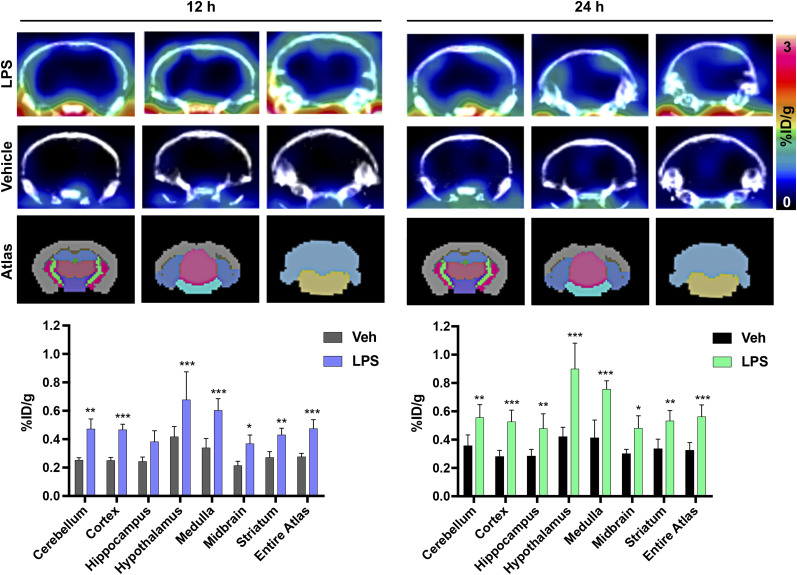
FIGURE 3.
Representative coronal brain PET/CT images of [64Cu]Cu-c[E4W5C] uptake and brain atlas–guided PET quantitation of vehicle vs. lipopolysaccharide-treated mice 12 and 24 h after tracer injection. Data are average percentage injected dose per gram ± SD (n = 4 animals per group). %ID/g = percentage injected dose per gram; LPS = lipopolysaccharide; Veh = vehicle. *P < 0.05. **P < 0.01. ***P < 0.001. (Figure was prepared at Stanford.)

